Statistics Cheatsheet
Cheatsheet Content
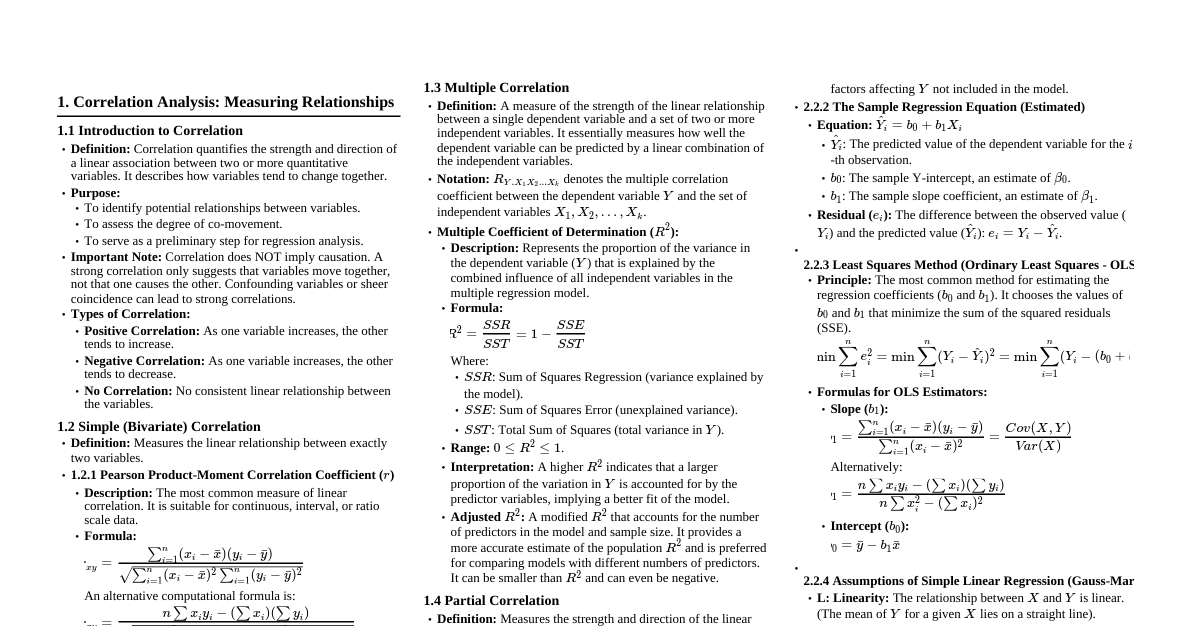
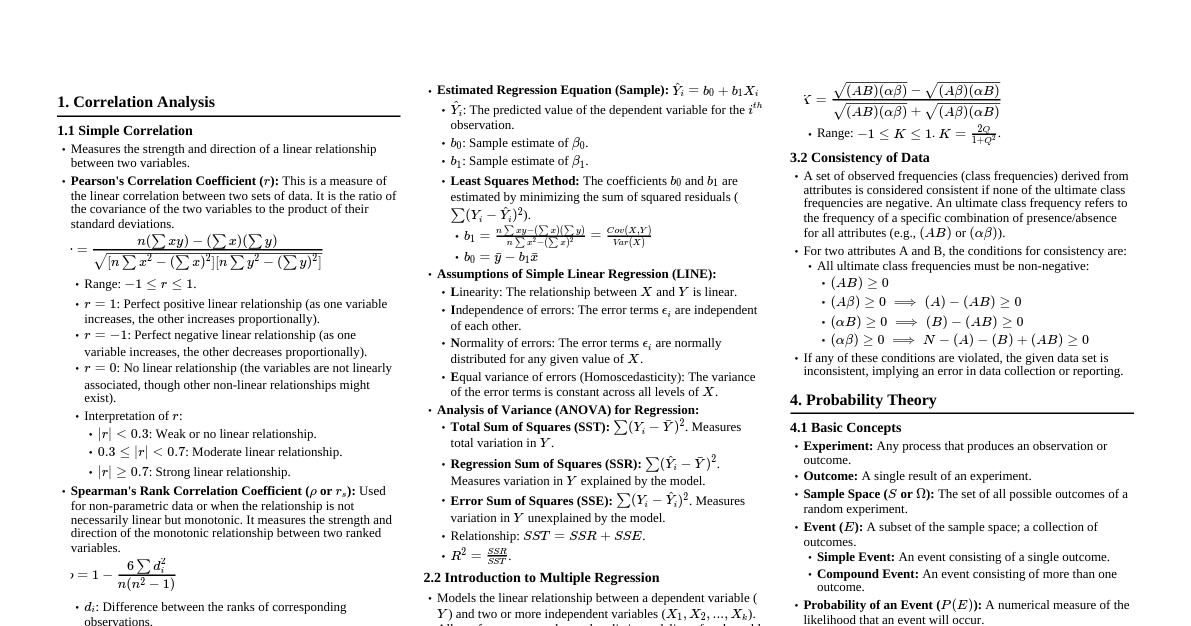
### Descriptive Statistics - **Mean (Average):** $\bar{x} = \frac{\sum x_i}{n}$ - **Median:** Middle value when data is ordered. If $n$ is even, average of the two middle values. - **Mode:** Most frequent value(s). - **Range:** Max value - Min value. - **Variance:** $s^2 = \frac{\sum (x_i - \bar{x})^2}{n-1}$ (sample), $\sigma^2 = \frac{\sum (x_i - \mu)^2}{N}$ (population) - **Standard Deviation:** $s = \sqrt{s^2}$ (sample), $\sigma = \sqrt{\sigma^2}$ (population) - **Interquartile Range (IQR):** $Q_3 - Q_1$ (difference between 75th and 25th percentiles). - **Outliers:** Values below $Q_1 - 1.5 \times IQR$ or above $Q_3 + 1.5 \times IQR$. ### Probability Basics - **Probability of Event A:** $P(A) = \frac{\text{Number of favorable outcomes}}{\text{Total number of outcomes}}$ - **Complement Rule:** $P(A') = 1 - P(A)$ - **Addition Rule:** - For mutually exclusive events: $P(A \text{ or } B) = P(A) + P(B)$ - For non-mutually exclusive events: $P(A \text{ or } B) = P(A) + P(B) - P(A \text{ and } B)$ - **Multiplication Rule:** - For independent events: $P(A \text{ and } B) = P(A) \times P(B)$ - For dependent events: $P(A \text{ and } B) = P(A) \times P(B|A)$ - **Conditional Probability:** $P(B|A) = \frac{P(A \text{ and } B)}{P(A)}$ - **Bayes' Theorem:** $P(A|B) = \frac{P(B|A)P(A)}{P(B)}$ ### Probability Distributions #### Discrete Distributions - **Binomial:** $P(X=k) = \binom{n}{k} p^k (1-p)^{n-k}$ - $n$: number of trials, $k$: number of successes, $p$: probability of success - Mean: $np$, Variance: $np(1-p)$ - **Poisson:** $P(X=k) = \frac{\lambda^k e^{-\lambda}}{k!}$ - $\lambda$: average rate of events in an interval - Mean: $\lambda$, Variance: $\lambda$ #### Continuous Distributions - **Normal (Gaussian):** $f(x) = \frac{1}{\sigma\sqrt{2\pi}} e^{-\frac{1}{2}(\frac{x-\mu}{\sigma})^2}$ - $\mu$: mean, $\sigma$: standard deviation - **Standard Normal (Z-score):** $Z = \frac{x - \mu}{\sigma}$ - **Uniform:** $f(x) = \frac{1}{b-a}$ for $a \le x \le b$, else 0 - Mean: $\frac{a+b}{2}$, Variance: $\frac{(b-a)^2}{12}$ ### Sampling Distributions - **Central Limit Theorem:** For a large sample size ($n \ge 30$), the sampling distribution of the sample mean ($\bar{x}$) will be approximately normal, regardless of the population distribution. - Mean of $\bar{x}$: $\mu_{\bar{x}} = \mu$ - Standard Error of $\bar{x}$: $\sigma_{\bar{x}} = \frac{\sigma}{\sqrt{n}}$ - For proportions: $\mu_{\hat{p}} = p$, $\sigma_{\hat{p}} = \sqrt{\frac{p(1-p)}{n}}$ ### Confidence Intervals - **General Formula:** Statistic $\pm$ (Critical Value $\times$ Standard Error) #### For Population Mean ($\mu$) - **Known $\sigma$ (Z-interval):** $\bar{x} \pm Z_{\alpha/2} \frac{\sigma}{\sqrt{n}}$ - **Unknown $\sigma$ (t-interval):** $\bar{x} \pm t_{\alpha/2, df=n-1} \frac{s}{\sqrt{n}}$ #### For Population Proportion ($p$) - **Large Sample:** $\hat{p} \pm Z_{\alpha/2} \sqrt{\frac{\hat{p}(1-\hat{p})}{n}}$ - Requires $n\hat{p} \ge 10$ and $n(1-\hat{p}) \ge 10$ #### Sample Size Calculation - **For Mean:** $n = \left(\frac{Z_{\alpha/2} \sigma}{E}\right)^2$ - **For Proportion:** $n = \hat{p}(1-\hat{p})\left(\frac{Z_{\alpha/2}}{E}\right)^2$ (use $\hat{p}=0.5$ for maximum sample size if unknown) ### Hypothesis Testing #### General Steps 1. **State Hypotheses:** Null ($H_0$) and Alternative ($H_1$). - $H_0$: parameter = value (e.g., $\mu = 10$) - $H_1$: parameter $\ne$, $ $ value (e.g., $\mu \ne 10$, $\mu 10$) 2. **Choose Significance Level:** $\alpha$ (e.g., 0.05, 0.01). 3. **Calculate Test Statistic:** (Observed - Expected) / Standard Error 4. **Find P-value or Critical Value(s).** 5. **Make Decision:** - If P-value $\le \alpha$, reject $H_0$. - If Test Statistic falls in critical region, reject $H_0$. 6. **State Conclusion:** Interpret in context of the problem. #### Common Test Statistics - **Z-test for Mean (known $\sigma$):** $Z = \frac{\bar{x} - \mu_0}{\sigma/\sqrt{n}}$ - **t-test for Mean (unknown $\sigma$):** $t = \frac{\bar{x} - \mu_0}{s/\sqrt{n}}$, $df = n-1$ - **Z-test for Proportion:** $Z = \frac{\hat{p} - p_0}{\sqrt{p_0(1-p_0)/n}}$ #### Errors in Hypothesis Testing - **Type I Error ($\alpha$):** Rejecting $H_0$ when it is true (False Positive). - **Type II Error ($\beta$):** Failing to reject $H_0$ when it is false (False Negative). - **Power of Test ($1-\beta$):** Probability of correctly rejecting a false $H_0$. ### Linear Regression - **Model:** $y = \beta_0 + \beta_1 x + \epsilon$ - $y$: dependent variable, $x$: independent variable - $\beta_0$: y-intercept, $\beta_1$: slope - $\epsilon$: error term - **Least Squares Estimates:** - Slope: $b_1 = \frac{n\sum(xy) - \sum x \sum y}{n\sum(x^2) - (\sum x)^2} = r \frac{s_y}{s_x}$ - Intercept: $b_0 = \bar{y} - b_1 \bar{x}$ - **Coefficient of Determination ($R^2$):** Proportion of variance in $y$ explained by $x$. - $R^2 = \frac{SSR}{SST} = 1 - \frac{SSE}{SST}$ - $0 \le R^2 \le 1$ - **Correlation Coefficient ($r$):** Measures strength and direction of linear relationship. - $r = \frac{n\sum(xy) - \sum x \sum y}{\sqrt{[n\sum x^2 - (\sum x)^2][n\sum y^2 - (\sum y)^2]}}$ - $-1 \le r \le 1$, $R^2 = r^2$ - **Standard Error of the Estimate ($s_e$):** Measures the typical distance between observed $y$ values and the regression line. ### ANOVA (Analysis of Variance) - **Purpose:** Compares means of three or more groups. - **Hypotheses:** - $H_0: \mu_1 = \mu_2 = ... = \mu_k$ (all group means are equal) - $H_1:$ At least one group mean is different - **Test Statistic:** $F = \frac{MS_{Between}}{MS_{Within}}$ - $MS_{Between} = \frac{SS_{Between}}{df_{Between}}$, where $df_{Between} = k-1$ ($k$ is number of groups) - $MS_{Within} = \frac{SS_{Within}}{df_{Within}}$, where $df_{Within} = N-k$ ($N$ is total sample size) - **Interpretation:** A large F-statistic suggests differences between group means. ### Chi-Square Tests - **Goodness-of-Fit Test:** - **Purpose:** Tests if observed frequencies match expected frequencies from a theoretical distribution. - **Hypotheses:** $H_0:$ Observed counts fit expected distribution, $H_1:$ Observed counts do not fit. - **Test Statistic:** $\chi^2 = \sum \frac{(O_i - E_i)^2}{E_i}$, $df = k-1$ ($k$ is number of categories). - **Test of Independence:** - **Purpose:** Tests if two categorical variables are independent. - **Hypotheses:** $H_0:$ Variables are independent, $H_1:$ Variables are dependent. - **Expected Count for cell $(i, j)$:** $E_{ij} = \frac{(\text{Row } i \text{ Total}) \times (\text{Column } j \text{ Total})}{\text{Grand Total}}$ - **Test Statistic:** $\chi^2 = \sum \frac{(O_{ij} - E_{ij})^2}{E_{ij}}$, $df = (R-1)(C-1)$ ($R$ rows, $C$ columns).