Indian Economy: Eve of Independence
Cheatsheet Content
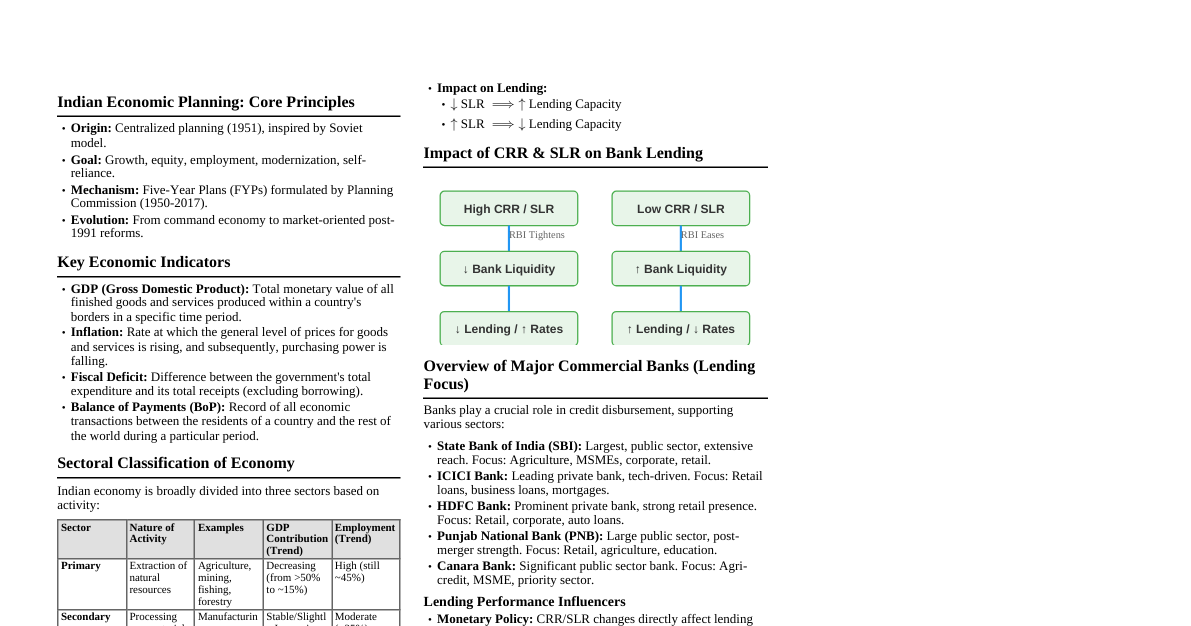
Indian Economy on the Eve of Independence Independent economy, agriculture and diverse handicrafts. British policies: India as raw material supplier, consumer of finished goods. Low development: GDP grew ~2%, PCI < 0.5% (V.K.R.V. Rao). Agricultural Sector Stagnation due to Zamindari system, low productivity, commercialization. Zamindari System: Land tax to British middlemen, profit to Zamindars. Industrial Sector Lack of strong base, deindustrialization (exporter of raw materials, importer of finished goods). TISCO (1907) only large-scale industry. No capital goods industry. Public Sector limited to essential services. Foreign Sector Exporter of primary products (raw silk, cotton, etc.), importer of finished goods. Suez Canal increased British control. Large export surplus but no benefit to India. Demographic Structure 1st Census: 1881. "Year of Great Divide": 1921 (High BR, Low DR). Low literacy (Total: 16%, Female: 7%), high infant mortality (238/thousand), low life expectancy (32 years). Occupational Structure Agriculture: 70-75% workforce. Manufacturing: 10%. Service: 15-20%. Infrastructure Developed by British (railways, ports, etc.) for colonial interests. Railways (1850): Enabled long-distance travel, commercialized agriculture, increased exports. Impact of British Rule Positive: Railways, commercial agriculture, infrastructure, education, social changes, unification, administration. Negative: Economic backwardness, stagnation due to exploitation and oppressive policies. Indian Economy 1950-1990 Economic System Definition: How societies/governments organize and distribute resources, services, goods. Regulates factors of production (land, capital, labor, physical resources). Basic types: Capitalism, Socialism, Mixed economy. Three questions: What to produce? How to produce? For whom to produce? Capitalism (Market Economy): Market forces (Demand & Supply) decide. Socialism: Government decides based on societal needs. Mixed Economy: Government and market together answer the questions. What is a Plan? Proposed goals for an economy within a specific period. Suggests optimum ways to utilize scarce resources. Planning Commission (1950): Set up by Nehru Govt. to implement plans. Planning Commission: 1950 Chairperson: Prime Minister. Implemented Five-Year Plans (FYPs). 12 FYPs implemented. Replaced by NITI Aayog in 2015 (Jan 1st). 1st FYP (1951-56): Focused on Agriculture. 2nd FYP (1956-61): Focused on Industrial sector. 12th FYP (2012-17): "Faster, more inclusive and Sustainable Growth." Planning in real sense began with 2nd FYP, based on P.C. Mahalanobis' ideas. Architect of Indian Planning: P.C. Mahalanobis. Father of Indian Planning: M Visweswaraiah (Planned Economy for India). Goals of FYPs in India Growth: Increase in country's capacity to produce goods and services. Implies larger stock of productive capital, supporting services, or increased efficiency. Steady increase in GDP is a good indicator. GDP: Money value of all final goods and services produced in domestic territory in a year. Agriculture, Industry, Service sectors are major GDP contributors. Modernization: Adopting new technology to increase production. Also includes changes in social outlook, e.g., women's rights, utilizing women's talents in workforce. Self-Reliance: Being self-dependent on goods and services required in the country. Promoting growth and modernization using own resources, avoiding imports. First seven FYPs emphasized avoiding imports of goods producible in India, especially food. Equity: Ensuring all Indians meet basic needs (food, housing, education, healthcare). Reducing wealth inequality. Benefits of economic prosperity reach poor sections. Agriculture, Industry and Trade in Independent India Agriculture At independence, land tenure system (zamindars, jagirdars) was dominant. Land reforms and Green Revolution were key changes. Equity in agriculture led to land reforms (change in ownership, abolition of intermediaries). Land ceiling: Fixing maximum land an individual can own to promote equity. Land Reforms Aims: Abolition of intermediaries, redistribution of land to landless farmers. Measures: Abolition of Zamindars, Tenancy reforms (rent regulation, tenure security), landholding ceiling, distribution of surplus land, consolidation of holdings, cooperative farming. Goal of equity not fully served due to loopholes and landlord challenges. Successful in Kerala and West Bengal due to committed governments. Green Revolution Large increase in food grain production using High Yielding Variety (HYV) seeds, irrigation, fertilizers. Father of Green Revolution: Norman Borlaug (World), Prof. M.S. Swaminathan (India). Stagnation from colonial rule broken by Green Revolution. First phase (mid-1960s to mid-1970s): HYV seeds restricted to affluent states (Punjab, Andhra Pradesh, Tamil Nadu), mainly wheat. Second phase (mid-1970s to mid-1980s): HYV technology spread to more states and crops. India became self-sufficient in food grains. Features of Green Revolution Use of HYV seeds, chemical fertilizers, pesticides. Modern farm implements (power tillers, tractors, water pumps). Better irrigation, easy credit at lower interest rates. Impacts of Green Revolution India became self-sufficient in food grains. Food grain prices declined, benefiting low-income groups. Govt. built food buffer stocks to meet shortages. Increased disparity between rich and poor farmers initially. HYV seeds prone to pests. Later, govt. provided low-interest loans and subsidized fertilizers to small farmers, benefiting both rich and small farmers. Debate Over Subsidies Necessary to incentivize adoption of new HYV technology. Economists suggest avoiding subsidies once technology is profitable and widely adopted. Others argue for continued subsidies due to farming risks and poverty of farmers, to avoid inequality. By late 1960s, Indian agriculture was self-sufficient in food grains. Occupational structure of the Indian economy (1950-51 vs 1990-91) Sector 1950-51 1990-91 Agriculture 72.1% 66.8% Industry 10.7% 12.7% Service 17.2% 20.5% Sectoral contribution to GDP (1950-51 vs 1990-91) Sector 1950-51 1990-91 Agriculture 59% 40.5% Industry 13% 24.6% Service 28% 34.9% Industry and Trade Industry provides stable employment, promotes modernization and prosperity. At independence, two well-managed iron and steel firms existed (Jamshedpur, Kolkata). Industrial policies introduced to promote industrial sector. FYPs emphasized industrial development; 2nd FYP focused on industry. Industrial Policy Resolution 1956 (IPR 1956) Basis for Second Five Year Plan. Classified industries into three categories: First category: Exclusively owned by the state (strategic industries like arms, atomic energy, iron and steel). Second category: Private sector allowed, but new units started under public sector control (coal, mineral oil, telephone manufacturing). Third category: Remaining industries for private sector. Private sector industries were under state control via licenses (e.g., food, clothes). Industrial licensing promoted industry in backward regions by making licenses easier to get and offering concessions (tax benefits, lower electricity tariff). Used to promote regional equality. Small Scale Industries (SSI) Defined by maximum investment allowed on assets. Investment limits: 1950: ₹5 Lakhs, 1966: ₹7.5 Lakhs, 1990: ₹60 Lakhs, 2020: ₹10 Cr. Advantages of SSI: Less capital investment, labor-intensive (more employment), less import dependence, less pollution, rural development. Trade Policy: Import Substitution First 7 FYPs adopted "inward-looking trade strategy" – Import Substitution Strategy. Aim: Replacing imports with domestic production. Government protected domestic industries from foreign competition through: Tariffs: Tax on imports to make them costlier. Quotas: Quantitative restrictions on imports to limit amounts. Effect of Policies on Industrial Development First seven FYPs significantly impacted industrial sector. Industry's GDP contribution rose from 13% (1950-51) to 24.6% (1990-91). Yearly growth rate of 6% was commendable. Protection allowed indigenous industries (electronics, automobile) to emerge. Some industries privatized, others remained public. Permit License Raj Excessive regulation on industrial licensing. Hindered efficiency by allowing "fake enterprises." System of licenses, regulations, and red tape that hampered business setup and running (1947-1990). Abolished in LPG program of 1991. Liberalisation, Privatisation and Globalisation (LPG): An Appraisal Background: Reasons for Economic Reforms - 1991 Political instability. Inefficient management of Indian Economy in 1980s. Foreign exchange spent on consumption needs. Foreign exchange reserves declined to less than two weeks' import cover. Gulf War (1990-91). Slow economic growth. Poor performance of public sector. Price rise of essential goods. Economic problems worsened from 1985. Imports swelled, leading to a twin deficit problem: Current Account Deficit ($M > X$). Fiscal Deficit ($TE > TR$). New Economic Policy (NEP-1991) India approached IBRD (World Bank) and IMF for a loan to manage the crisis. Received $7 billion loan with conditions to liberalize and open up the economy, removing trade restrictions. Wide-ranging economic reforms announced in 1991. Two-part programme: Stabilization measures: Short-term steps to control inflation and resolve Balance of Payment crisis. Structural Adjustment Programmes (SAP): Long-term measures to improve economic efficiency. These reforms are classified into three heads: Liberalization, Privatization, Globalization. 1. Liberalization Means freeing the economy from restrictions. Major reforms: Industrial Sector Reforms: Industrial sector deregulated. Industrial licensing abolished (except for few industries like defense, atomic energy, alcohol, tobacco, hazardous chemicals, pharmaceuticals). Only some industries reserved for public sector. Amendments to MRTP (Monopolies and Restrictive Trade Practices) Act and FERA (Foreign Exchange Regulation Act, later FEMA). De-reservation of goods for small-scale sector. Financial Sector Reforms: Bank branch licensing liberalized. RBI's role reduced from 'regulator' to 'facilitator'. New generation banks and foreign banks allowed. CRR (Cash Reserve Ratio) and SLR (Statutory Liquidity Ratio) reduced. Insurance sector privatized. Promotion of liberalization of Capital Market. Tax Reforms: Income tax, Excise duty, customs duty, and corporate tax reduced. Introduction of GST (July 2017). Foreign Exchange Reforms: Devaluation of Indian Rupee (money value declined by govt.). Fixed exchange rate system replaced by market-determined (floating) exchange rate. Trade and Investment Policy Reforms: Quantitative restrictions (quotas) on imports removed. Reduction of tariff rates. Imports liberalized. Export duties removed (export promotion). 2. Privatization Giving ownership of government enterprises to private companies. Opening up industries previously reserved for the public sector to the private sector. Part of Structural Adjustment Programme (SAP). Two ways: Withdrawal of government from ownership. Disinvestment: Selling government shares of Public Sector Undertakings (PSUs) to the private sector. Aims of Disinvestment Better performance of PSUs through improved management. Enforce financial discipline and improve financial performance of PSUs. Enhance ability of companies to raise financial resources. Raise government revenue. Strong impetus to FDI (Foreign Direct Investment). Privatization Advantages Profit motive leads to more income. Increased efficiency due to better management. Private sector has long-term goals (govt. has short-term). Increased competition leads to better performance. 3. Globalization Integration of the economies of the world. Implies: Closer integration of economies. Free flow of goods, services, capital, and knowledge. Extension of market. Outsourcing Sourcing services from outside (external sources). Important outcome of globalization. India became a good destination for outsourcing (software, IT-enabled services, BPO, KPO) due to: Low wage rate of laborers. Availability of skilled laborers. Proficiency in English language. Better time zone. World Trade Organization (WTO) Founded in 1995, replacing GATT (General Agreement on Tariffs and Trade, established 1948). Aims of WTO: Provide equal opportunities for all nations in international trade. Ensure optimum utilization of world resources and protect the environment. Remove tariffs and non-tariff barriers (quotas). Facilitate free entry and exit of goods. Encourage multilateral trade. Extend trade to services (banking, insurance, communication). Include Trade-Related Intellectual Property Rights (TRIPs) and Trade-Related Investment Measures (TRIMs). Indian Economy During Reforms of 1991: An Assessment (Impact of NEP) 28 years of economic reforms. Positive Impacts GDP increased from 5.79% (1980) to 7.6% (2016). Foreign investment increased (from $103 million in 1991 to $20243 million in 2005-06). Foreign exchange reserves increased. Exports increased. Poverty rate decreased to 22% by 2012. Negative Impacts Agriculture neglected. Growth concentrated in urban areas. Spread of consumerism. Increased economic disparity between rich and poor. Poverty Definition of Poverty A state where an individual cannot fulfill basic necessities: food, clothing, education, etc. Multi-dimensional concept. Measured based on the poverty line. Two Measures to Define Poverty 1. Absolute Poverty Refers to the total number of people below the poverty line. Measured by: Minimum Calorie Consumption Criteria: Rural: 2400 calories/person/day. Urban: 2100 calories/person/day. Minimum Consumption Expenditure Criteria: 2011-12: Monthly per capita consumption expenditure of Rs 972 (rural) and Rs 1,407 (urban). Daily: Rs 32 (rural) and Rs 47 (urban). 2. Relative Poverty Poverty of people compared to others in different regions or nations. Does not consider minimum requirements, but compares income and asset inequality. Helps understand relative positions within population segments. Demerit: Only reflects relative position in income hierarchy. Features of Poverty Food shortage and starvation. Illiteracy and less skilled individuals. Limited level of opportunities. Higher level of unemployment. Malnutrition. Poor health status. Huge debt burden. Lack of drinking water and sanitation facilities. Gender discrimination. Poor in Rural and Urban Areas Rural: Landless agricultural laborers, cultivators with small landholdings, or landless laborers. Urban: Migrated people from rural areas (for employment), casual laborers, self-employed street vendors. Importance of Poverty Measurement To find viable and sustainable strategies to address poverty causes. To design schemes to help the poor. To identify the poor for programme implementation. Poverty Measurement Methods Government uses Monthly Per Capita Expenditure (MPCE) as a proxy for income. Demerits of MPCE method: Groups all poor together, doesn't differentiate between very poor and other poor. Only considers expenditure on food and few select items. Difficult to identify who among the poor needs help the most. Doesn't consider social factors (illiteracy, ill health, lack of resources, discrimination, lack of freedoms). Poverty Line Level of income to meet minimum living conditions/basic needs. Money value of goods and services for basic welfare. Differs across countries. People below poverty line are poor, above are non-poor. Planning Commission defined poverty line based on nutritional requirements: 2400 calories (rural), 2100 calories (urban). Concept of a Poverty Line: Attempts Dadabhai Naoroji: First to discuss 'jail cost of living' as poverty line. Study Group (1962): Rs 20 (rural) and Rs 25 (urban) per capita/month. YK Alagh Committee (1979): Calorie-based (2400 rural, 2100 urban). Lakdawala Expert Group (1989): Retained Alagh report's poverty line. Suresh Tendulkar Committee (2005): Adopted 2004-05 urban poverty line based on Lakdawala methodology. Rangarajan Committee (2014): Reverted to separate all-India rural and urban poverty lines and state-level estimates. Causes of Poverty Low income. High illiteracy rate. Lack of assets. Unemployment. Inequality. Exploitation. Population explosion. Undesirable economic growth. Inflation. Absence of industrialization. Poor and Non-Poor Poverty line separates poor and non-poor. Poor categories: Absolutely poor, poor, very poor. Non-poor categories: Middle class, upper middle class, rich, very rich, absolutely rich. Categorizing Poverty Chronic Poor: Always poor, usually poor. Transient Poor: Churning poor, occasionally poor. Non-Poor: Never poor. Visual representation of poverty categories based on poverty line: Poverty Line Always Poor Poverty Line Usually Poor Poverty Line Churning Poor Poverty Line Occasionally Poor Poverty Line Never Poor Development Removing obstacles (illiteracy, ill health, lack of resources/freedoms) that hinder a person's life. Sen Index mentioned for poverty eradication. Number of Poor in India Estimated by "Head Count Ratio" (proportion of people below poverty line). Official data based on NSSO consumption expenditure data. World Bank (2019): 6% of population (84 million) in poverty. ADB (2019): 7.7% employed population below $1.90 PPP/day. Unemployment rate (2020): 7.1%. Child mortality (2019): 34/1000 births. 7% of Indian population in extreme poverty. Global Hunger Index (2021): India ranks 101st out of 116 (score 27.5 - serious hunger). World Bank (post-pandemic): Number of poor (income < $2/day PPP) more than doubled to 134 million from 60 million. Number of Poor (Historical Data) Years No. of Poor Percentage to total population 1973-74 320 million 55% 2011-12 270 million 22% Methods to Remove Poverty Accelerate economic growth. Reduce income inequalities. Population control. Ensure more employment opportunities. Land reforms (land for landless laborers). Poverty Eradication Programmes Classified into Self-Employment, Wage Employment, Social Security, and Food Security Programmes. Self-Employment Programmes Integrated Rural Development Programme (IRDP): Introduced 1980, renamed Swarnajayanthi Grama Swarojgar Yojana (SGSY) in 1999. SGSY: Merged TRYSEM, DWCRA, GKY, MSW, SITRA programs. Forms SHGs, develops infrastructure, technology, credit, and marketing. Wage Employment Programmes National Rural Employment Programme (NREP): Renamed Food for Work Programme (1980). Centrally sponsored. Develops community assets (wells, roads, schools). Rural Landless Employment Guarantee Programme (RLEGP): Launched 1983 to supplement NREP. 100% Union Govt. funded. Jawahar Rozgar Yojana (JRY) & Nehru Rozgar Yojana (NRY): NREP and RLEGP merged into JRY (1999). Aims for gainful employment in rural areas. NRY for urban areas. Million Well Scheme (MWS): Open irrigation wells for poor SC/ST farmers. Indira Awas Yojana (IAY): Houses for SC/ST and other poor families. Pradhan Mantri Gramodaya Yojana: Gramin Awas (PMRY-GA): Launched 2000 for rural housing. National Rural Employment Guarantee Programme (NREGP) / MGNREGP (2005): Guarantees 100 days of unskilled manual work per household per year. Implemented in backward districts first, then nationwide. Renamed Mahatma Gandhi NREGP. Social Security Programmes Old-age pension for elderly without support. Financial support for breadwinner's death. Support for poor women during pregnancy. Food Security Programmes Aims to ensure food security for masses, addressing distribution issues despite sufficient production. Public Distribution System (PDS): Food grains at cheaper prices through Fair Price Shops, ration shops. Targeted Public Distribution System (TPDS): Initiated 1997, aims at BPL families. Integrated Child Development Schemes (ICDS): Nutrition for children <6, pregnant/lactating women. Mid-day Meal at School (PM Poshan): Launched 1995 nationally. Annapurna Scheme (2000-01): Covers poor old people not receiving pensions. Antyodaya Anna Yojana: Highly subsidized food grains for the poorest of the poor. Poverty Alleviation Programmes: A Critical Assessment Improved PCI (1950-51: Rs 274, 2010-11: Rs 54,835) and average standard of living. No radical changes in asset ownership, production, or basic facilities for the needy. Major areas of concern: Unequal distribution of land/assets means benefits appropriated by non-poor. Insufficient resource allocation compared to poverty magnitude. Non-participation of local level institutions. Steps for Successful Implementation of Programmes Poverty eradicated when poor actively contribute to growth through social mobilization and empowerment. Create employment opportunities, increase income, skill development, health, and literacy. Identify poverty-stricken areas and provide infrastructure (schools, roads, power, telecom, IT, training).