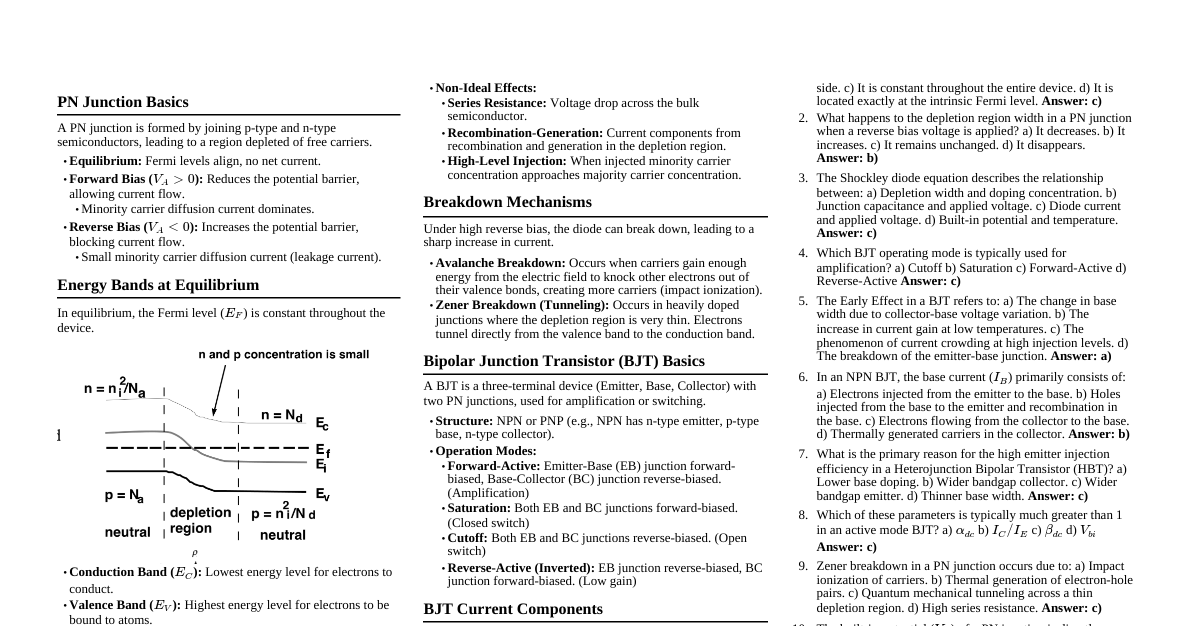
Comprehensive ML Cheatsheet
Cheatsheet Content
### Introduction to AI and Machine Learning Artificial Intelligence (AI) and Machine Learning (ML) are transformative fields at the intersection of computer science, statistics, and mathematics. - **AI Definition**: Simulation of human intelligence in machines programmed to think and act like humans. Ranges from rule-based systems to complex neural networks. - **ML Definition**: A subset of AI focused on developing algorithms that allow computers to learn from data without explicit programming. Models identify patterns and make predictions or decisions. This cheatsheet aims to provide a comprehensive, in-depth exploration of key concepts in Machine Learning, starting from its historical evolution, foundational principles, various learning paradigms, core algorithms, and advanced topics. We will delve into the mathematical underpinnings, derivations, and theoretical explanations to ensure a thorough understanding for beginners and seasoned learners alike. ### Evolution of AI The journey of Artificial Intelligence is long and fascinating, marked by periods of immense optimism ("AI summers") and skepticism ("AI winters"). #### Early Foundations (1940s-1950s) - **Turing Test (1950)**: Alan Turing proposed a test for machine intelligence, where a human interrogator distinguishes between a human and a machine based on textual conversations. Laid philosophical groundwork for AI. - **Perceptron (1957)**: Frank Rosenblatt developed the Perceptron, the first artificial neural network, capable of learning to classify patterns. Marked the beginning of connectionism. #### The Golden Age of AI (1950s-1970s) - **Dartmouth Workshop (1956)**: Considered the birth of AI as a field. John McCarthy coined the term "Artificial Intelligence." - **Logic Theorist & General Problem Solver**: Early AI programs that could prove theorems and solve general problems, demonstrating symbolic reasoning. - **Expert Systems**: Rule-based systems that encoded human expert knowledge to solve complex problems in specific domains (e.g., MYCIN for medical diagnosis). #### AI Winter (1970s-1980s) - **Limitations**: Early AI systems faced limitations in handling real-world complexity, common sense reasoning, and computational power. Funding decreased, leading to reduced research and public interest. #### Resurgence and Machine Learning Boom (1990s-2000s) - **Increased Computational Power**: Moore's Law led to more powerful and affordable computers. - **Larger Datasets**: The rise of the internet and digital data collection provided ample data for learning algorithms. - **New Algorithms**: Development of algorithms like Support Vector Machines (SVMs) and ensemble methods (e.g., Random Forests) showed significant promise. - **Probabilistic Methods**: Bayesian networks and other probabilistic graphical models gained prominence. #### Deep Learning Revolution (2010s-Present) - **Deep Neural Networks**: Resurgence of neural networks with multiple layers (deep learning) achieved breakthroughs in image recognition, natural language processing, and speech recognition. - **GPUs**: Graphics Processing Units provided the parallel processing power needed to train deep models on vast datasets. - **Big Data**: Availability of massive datasets fueled the training of highly complex models. - **Reinforcement Learning**: Significant advancements in reinforcement learning (e.g., AlphaGo beating human Go champions). - **Generative AI**: Recent developments in models capable of generating realistic text, images, and other media. The evolution of AI has been a continuous cycle of innovation, challenge, and adaptation, leading to the sophisticated and ubiquitous AI systems we see today. ### Four Pillars of Machine Learning Machine Learning, at its core, relies on four fundamental components that enable systems to learn from data. Understanding these pillars is crucial for building and analyzing ML models. #### 1. Data - **Definition**: The raw material for any machine learning algorithm. Consists of observations, measurements, features, and labels that the model uses to learn patterns. - **Importance**: Quality, quantity, and relevance of data directly impact model performance and generalization. "Garbage in, garbage out." - **Types of Data**: - **Structured Data**: Organized in tabular format (e.g., databases, spreadsheets). - **Unstructured Data**: Lacks a predefined format (e.g., text, images, audio, video). - **Semi-structured Data**: Contains tags or markers but doesn't conform to rigid relational structure (e.g., XML, JSON). - **Data Preprocessing**: Critical step involving cleaning, transformation, feature engineering, normalization, and handling missing values. Includes: - **Missing Value Imputation**: Replacing missing values with estimates (mean, median, mode). - **Outlier Detection and Handling**: Identifying and managing extreme data points. - **Feature Scaling**: Normalizing or standardizing features to a similar range (e.g., Min-Max scaling, Z-score standardization). - **Feature Engineering**: Creating new features from existing ones to improve model performance. - **Encoding Categorical Variables**: Converting categorical data into numerical format (e.g., one-hot encoding, label encoding). #### 2. Model - **Definition**: A mathematical representation of the underlying patterns and relationships within the data. It is the algorithm or function that learns from the data. - **Importance**: Choice of model depends on problem type (e.g., classification, regression), data nature, and computational resources. - **Examples**: Linear Regression, Decision Trees, Support Vector Machines, Neural Networks, K-Nearest Neighbors, etc. - **Model Parameters**: Values within the model that are learned from the data during training (e.g., weights and biases in a neural network). - **Hyperparameters**: Configuration settings external to the model, not learned from data. Set before training (e.g., learning rate, number of layers, regularization strength). #### 3. Objective Function (Loss Function / Cost Function) - **Definition**: Quantifies how well a machine learning model performs on a given dataset. Measures discrepancy between model predictions and actual target values. - **Importance**: Goal of training is to minimize this function (for loss/cost functions) or maximize it (for reward functions in reinforcement learning) to find optimal model parameters. - **Mathematical Formulation**: Let $y_i$ be the true value and $\hat{y}_i$ be the predicted value for the $i$-th data point. A loss function $L(y_i, \hat{y}_i)$ calculates the error for a single data point. The overall objective function $J(\theta)$ is typically the average of these individual losses: $$ J(\theta) = \frac{1}{N} \sum_{i=1}^N L(y_i, \hat{y}_i) $$ where $\theta$ represents the model parameters. - **Examples**: - **Mean Squared Error (MSE)**: For regression, $L(y_i, \hat{y}_i) = (y_i - \hat{y}_i)^2$. - **Cross-Entropy Loss**: For classification, measures the difference between two probability distributions. - **Hinge Loss**: For Support Vector Machines. #### 4. Optimization Algorithm - **Definition**: A method used to adjust the model's parameters iteratively to minimize the objective function. Finds the "best" set of parameters that make the model's predictions as accurate as possible. - **Importance**: Without an effective optimization algorithm, even a good model and abundant data cannot lead to optimal performance. - **Process**: Optimization typically involves calculating the gradient of the objective function with respect to the model parameters and then updating the parameters in the direction that reduces the loss. - **Examples**: - **Gradient Descent**: Iterative optimization algorithm that takes steps proportional to the negative of the gradient of the function at the current point. - **Batch Gradient Descent**: Uses the entire dataset to compute the gradient for each step. - **Stochastic Gradient Descent (SGD)**: Uses a single randomly chosen data point to compute the gradient for each step. - **Mini-Batch Gradient Descent**: Uses a small random subset of the data to compute the gradient. - **Adam, RMSprop, Adagrad**: More advanced adaptive learning rate optimization algorithms. - **Newton's Method**: Uses second-order derivatives (Hessian matrix) for faster convergence but is computationally more expensive. These four pillars are interconnected and form the foundation upon which all machine learning models are built and trained. ### Machine Learning Types Machine learning paradigms are broadly categorized based on the nature of the learning signal or feedback available to the learning system. #### 1. Supervised Learning - **Definition**: Model learns from a labeled dataset, where each input data point is paired with a corresponding correct output or "label." Goal is to learn a mapping function from inputs to outputs. - **Process**: Model trained on labeled data, minimizing the difference between predictions and actual labels. Once trained, it can predict outputs for new, unseen data. - **Key Characteristics**: - Requires labeled training data. - Direct feedback on predictions during training. - Aims to generalize to unseen data. - **Common Tasks**: - **Regression**: Predicting a continuous output value (e.g., house prices, temperature). - **Classification**: Predicting a discrete class label (e.g., spam/not spam, cat/dog, disease diagnosis). - **Algorithms**: Linear Regression, Logistic Regression, Support Vector Machines (SVMs), Decision Trees, Random Forests, K-Nearest Neighbors (KNN), Neural Networks. - **Mathematical Intuition**: Given a dataset $D = \{(x_i, y_i)\}_{i=1}^N$ where $x_i$ are input features and $y_i$ are corresponding labels, the goal is to learn a function $f: X \to Y$ such that $f(x_i) \approx y_i$. This is typically achieved by minimizing a loss function $L(y_i, f(x_i))$ over the training data. #### 2. Unsupervised Learning - **Definition**: Deals with unlabeled data. Model is given only input data and must find patterns, structures, or relationships within the data without explicit guidance. - **Process**: Algorithms identify inherent groupings or features within the data, often used for exploratory data analysis or as a preprocessing step for other learning tasks. - **Key Characteristics**: - Works with unlabeled data. - No direct feedback on predictions. - Aims to discover hidden structures or representations. - **Common Tasks**: - **Clustering**: Grouping similar data points together (e.g., customer segmentation). - **Dimensionality Reduction**: Reducing the number of features while preserving important information (e.g., PCA for visualization or noise reduction). - **Association Rule Mining**: Discovering relationships between variables in large datasets (e.g., market basket analysis). - **Density Estimation**: Estimating the probability distribution of data. - **Algorithms**: K-Means Clustering, Hierarchical Clustering, Principal Component Analysis (PCA), Independent Component Analysis (ICA), Autoencoders, Gaussian Mixture Models (GMMs). - **Mathematical Intuition**: Given a dataset $D = \{x_i\}_{i=1}^N$, the goal is to find some underlying structure or representation $z_i = g(x_i)$ or a partition of the data $C_1, \dots, C_k$ such that data points within a cluster are similar. This often involves optimizing a measure of similarity or dissimilarity. #### 3. Semi-Supervised Learning - **Definition**: Falls between supervised and unsupervised learning. Uses a combination of a small amount of labeled data and a large amount of unlabeled data for training. - **Process**: Model leverages unlabeled data to improve understanding of data distribution, enhancing performance when limited labeled data is available. Useful when labeling data is expensive. - **Key Characteristics**: - Leverages both labeled and unlabeled data. - Can achieve better performance than purely supervised learning with limited labels. - **Common Techniques**: - **Self-training**: Model trained on labeled data, then uses its own predictions on unlabeled data as "pseudo-labels" for further training. - **Co-training**: Two or more models trained on different feature sets of the same data, iteratively teaching each other. - **Generative Models**: Models like GANs or VAEs learn data distribution from unlabeled data, aiding classification tasks. - **Transductive SVMs**: Extend SVMs to handle unlabeled data by finding a decision boundary that optimally separates unlabeled points. - **Mathematical Intuition**: Objective function often combines a supervised loss term for labeled data and an unsupervised regularization term for unlabeled data, encouraging consistency across the entire dataset. #### 4. Reinforcement Learning (RL) - **Definition**: Agent learns to take actions in an "environment" to maximize a cumulative "reward." - **Process**: Agent learns through trial and error, receiving rewards for desirable actions and penalties for undesirable ones. Learns from interactions with the environment, no labeled data needed. - **Key Characteristics**: - Agent interacts with an environment. - Learns through rewards and penalties. - Goal-oriented, aims to maximize cumulative reward. - Deals with sequential decision-making. - **Components**: - **Agent**: The learner or decision-maker. - **Environment**: The world the agent interacts with. - **State**: Current situation of the environment. - **Action**: What the agent can do in a given state. - **Reward**: Numerical feedback signal indicating the desirability of an action. - **Policy**: A strategy that maps states to actions. - **Value Function**: Predicts the future reward from a given state or state-action pair. - **Common Tasks**: Robotics, game playing (e.g., AlphaGo, chess), autonomous driving, resource management, recommendation systems. - **Algorithms**: Q-learning, SARSA, Deep Q-Networks (DQN), Policy Gradients, Actor-Critic methods. - **Mathematical Intuition**: The core idea is to learn an optimal policy $\pi^*$ that maximizes the expected cumulative reward $E[\sum_{t=0}^\infty \gamma^t R_{t+1} | S_0 = s]$, where $\gamma$ is the discount factor. This often involves solving the Bellman equation. #### 5. Self-Supervised Learning - **Definition**: A form of unsupervised learning where the system generates its own labels from the input data. It creates a "pretext task" to learn useful representations without human annotation. - **Process**: A part of the input data is used to predict another part of the same data (e.g., predicting missing words, future video frames, rotated image angles). Model learns powerful feature representations, transferable to downstream supervised tasks with less labeled data. - **Key Characteristics**: - No human-annotated labels required for the pretext task. - Learns powerful general-purpose representations. - Bridges the gap between supervised and unsupervised learning. - **Common Tasks/Techniques**: - **Predicting missing parts**: Masked Language Modeling (BERT), image inpainting. - **Context prediction**: Predicting surrounding words (Word2Vec). - **Contrastive Learning**: Learning representations by pulling similar samples closer and pushing dissimilar samples apart in an embedding space (SimCLR, MoCo). - **Generative tasks**: Autoencoders, predicting future frames. - **Algorithms**: BERT, GPT, SimCLR, MAE (Masked Autoencoders). - **Mathematical Intuition**: The objective function is designed around the pretext task. For instance, in masked language modeling, it's a cross-entropy loss over the predicted masked tokens. In contrastive learning, it's a loss that maximizes agreement between different views of the same data point. #### 6. Active Learning - **Definition**: A special case of supervised learning where the algorithm interactively queries a user (or other information source) to label new data points. - **Process**: Active learner selects the most informative unlabeled data points to be labeled, reducing the amount of labeled data needed to achieve high accuracy. - **Key Characteristics**: - Learner actively queries for labels. - Aims to minimize labeling effort. - Useful when labeling is expensive. - **Query Strategies**: - **Uncertainty Sampling**: Querying data points for which the model is most uncertain about its prediction. - **Query-by-Committee**: Multiple models are trained, and the data point on which they most disagree is queried. - **Density-Weighted Uncertainty Sampling**: Considers both uncertainty and how representative a data point is of the overall data distribution. - **Mathematical Intuition**: The core is to define an informativeness measure $I(x)$ for unlabeled data point $x$. The algorithm selects $x^* = \arg \max I(x)$ and requests its label. #### 7. Transformer Networks - **Definition**: A type of neural network architecture introduced in 2017, primarily designed for sequence-to-sequence tasks in Natural Language Processing (NLP), with applications now in computer vision and other domains. - **Key Innovation**: **Attention Mechanism**: Transformers revolutionized sequence modeling by replacing recurrent (RNNs) and convolutional (CNNs) layers with a self-attention mechanism. This allows the model to weigh the importance of different parts of the input sequence when processing each element, capturing long-range dependencies effectively. - **Architecture**: - **Encoder-Decoder Structure**: Both encoder and decoder composed of multiple identical layers. - **Multi-Head Self-Attention**: Allows the model to attend to different parts of the input from various "perspectives" simultaneously. - **Positional Encoding**: Added to input embeddings to provide information about the relative or absolute position of tokens, as self-attention doesn't inherently capture sequence order. - **Feed-Forward Networks**: Each attention sub-layer is followed by a simple position-wise fully connected feed-forward network. - **Layer Normalization & Residual Connections**: Used throughout the network to stabilize training and improve gradient flow. - **Advantages**: - **Parallelization**: Self-attention can be computed in parallel, leading to faster training. - **Long-Range Dependencies**: Effectively captures relationships between distant tokens in a sequence. - **State-of-the-Art Performance**: Achieved breakthrough results in machine translation, text summarization, question answering, and more. - **Algorithms/Models**: BERT, GPT (Generative Pre-trained Transformer), T5, Vision Transformers (ViT). - **Mathematical Intuition (Self-Attention)**: The core idea is to compute three vectors for each token in a sequence: Query (Q), Key (K), and Value (V). The attention scores are calculated as a scaled dot product of Q with $K^T$, passed through a softmax function, and then multiplied by V. $$ \text{Attention}(Q, K, V) = \text{softmax}\left(\frac{QK^T}{\sqrt{d_k}}\right)V $$ where $d_k$ is the dimension of the key vectors, used for scaling. #### 8. Metric Learning - **Definition**: A subfield of machine learning that aims to learn a distance function (or metric) from data. This learned metric should reflect the similarity or dissimilarity between data points in a way that is useful for downstream tasks. - **Process**: Instead of using a standard Euclidean distance, metric learning algorithms learn a transformation of the input space such that similar items are close together and dissimilar items are far apart in the transformed space. - **Importance**: A good distance metric is crucial for many algorithms that rely on similarity, such as K-Nearest Neighbors (KNN), K-Means Clustering, and Support Vector Machines (SVMs) with RBF kernels. - **Key Concepts**: - **Similarity/Dissimilarity**: Defining what makes two data points "similar" or "dissimilar" based on the task. - **Embeddings**: Often involves learning an embedding space where distances directly correspond to semantic similarity. - **Common Tasks**: Face recognition, image retrieval, person re-identification, recommendation systems. - **Algorithms/Loss Functions**: - **Siamese Networks**: Neural networks that learn a mapping to an embedding space where distances between pairs of inputs are minimized for similar pairs and maximized for dissimilar pairs. - **Triplet Loss**: A loss function used in deep metric learning, where the model is trained to ensure that an "anchor" sample is closer to a "positive" sample (similar) than to a "negative" sample (dissimilar) by a certain margin. - **Contrastive Loss**: Similar to triplet loss, but operates on pairs of samples (positive and negative pairs). - **Mahalanobis Distance Learning**: Learning a linear transformation (matrix M) such that the Mahalanobis distance $d_M(x_i, x_j) = \sqrt{(x_i - x_j)^T M (x_i - x_j)}$ reflects desired similarities. - **Mathematical Intuition (Triplet Loss)**: Given an anchor $a$, a positive sample $p$ (similar to $a$), and a negative sample $n$ (dissimilar to $a$), the triplet loss aims to satisfy: $$ ||f(a)-f(p)||^2 + \alpha ### The Single Neuron (Perceptron) The single neuron, also known as the Perceptron, is the fundamental building block of artificial neural networks. Inspired by the biological neuron, it's a simple model capable of learning linear decision boundaries. #### Biological Neuron Analogy - **Dendrites**: Receive signals from other neurons (inputs). - **Cell Body (Soma)**: Processes the signals. - **Axon**: Transmits the processed signal. - **Synapses**: Connections between neurons, where signals are passed and their strength can be adjusted. #### Mathematical Model of a Single Neuron A single neuron receives multiple input signals, each multiplied by a weight, sums them up, adds a bias, and then passes the result through an activation function to produce an output. 1. **Inputs ($x_1, x_2, \dots, x_n$)**: Features of the input data point. 2. **Weights ($w_1, w_2, \dots, w_n$)**: Each input $x_i$ is associated with a weight $w_i$. Weights represent the strength or importance of each input. 3. **Bias ($b$)**: An additional parameter that allows the decision boundary to be shifted independently of the inputs. Can be thought of as an input with a constant value of 1 and its own weight. 4. **Weighted Sum (Net Input) ($z$)**: Inputs are multiplied by their respective weights, and these products are summed up. The bias is then added. $$ z = \sum_{i=1}^n (x_i w_i) + b = \mathbf{w}^T \mathbf{x} + b $$ where $\mathbf{w}$ is the vector of weights and $\mathbf{x}$ is the vector of inputs. 5. **Activation Function ($f$)**: The weighted sum $z$ is passed through a non-linear activation function. This function introduces non-linearity, allowing the model to learn complex patterns. 6. **Output ($y$)**: The result of the activation function is the neuron's output. $$ y = f(z) = f(\mathbf{w}^T \mathbf{x} + b) $$ #### Common Activation Functions for a Single Neuron (Perceptron) For the original Perceptron, the activation function was typically a step function. For more general single neurons and in later neural networks, other functions are used. 1. **Step Function (Heaviside Step Function)**: $$ f(z) = \begin{cases} 1 & \text{if } z \ge 0 \\ 0 & \text{if } z ### Regression Regression is a supervised learning task where the goal is to predict a continuous output variable (dependent variable) based on one or more input features (independent variables). #### 1. Linear Regression Linear Regression is one of the simplest and most widely used statistical models. It assumes a linear relationship between the input features and the output variable. - **Model Hypothesis**: The hypothesis function for linear regression with $n$ features is: $$ h_\theta(\mathbf{x}) = \theta_0 + \theta_1 x_1 + \theta_2 x_2 + \dots + \theta_n x_n $$ In vector form: $$ h_\theta(\mathbf{x}) = \boldsymbol{\theta}^T \mathbf{x} $$ where $\mathbf{x} = [1, x_1, x_2, \dots, x_n]^T$ is the feature vector (with $x_0 = 1$ for the intercept term) and $\boldsymbol{\theta} = [\theta_0, \theta_1, \dots, \theta_n]^T$ is the parameter vector. - **Cost Function (Mean Squared Error - MSE)**: To find the optimal parameters $\boldsymbol{\theta}$, we need a cost function that measures the difference between the predicted values and the actual target values. The most common choice for linear regression is the Mean Squared Error (MSE). Given a training set of $m$ examples $\{(\mathbf{x}^{(i)}, y^{(i)})\}_{i=1}^m$: $$ J(\boldsymbol{\theta}) = \frac{1}{2m} \sum_{i=1}^m (h_\theta(\mathbf{x}^{(i)}) - y^{(i)})^2 $$ The factor of $\frac{1}{2}$ is for mathematical convenience, as it simplifies the derivative. The goal is to minimize $J(\boldsymbol{\theta})$. ##### A. Matrix-Based (Normal Equation) The normal equation provides a closed-form solution to find the optimal parameters directly, without any iterative optimization. Let $X$ be the design matrix of dimensions $m \times (n+1)$, where each row is an input feature vector $\mathbf{x}^{(i)}$ (with $x_0=1$) and $Y$ be the target vector of dimensions $m \times 1$. $$ X = \begin{pmatrix} -- (\mathbf{x}^{(1)})^T -- \\ -- (\mathbf{x}^{(2)})^T -- \\ \vdots \\ -- (\mathbf{x}^{(m)})^T -- \end{pmatrix}, \quad Y = \begin{pmatrix} y^{(1)} \\ y^{(2)} \\ \vdots \\ y^{(m)} \end{pmatrix} $$ The cost function in matrix form is: $$ J(\boldsymbol{\theta}) = \frac{1}{2m} (X\boldsymbol{\theta} - Y)^T (X\boldsymbol{\theta} - Y) $$ To find the $\boldsymbol{\theta}$ that minimizes $J(\boldsymbol{\theta})$, we take the derivative with respect to $\boldsymbol{\theta}$ and set it to zero: $$ \nabla_\boldsymbol{\theta} J(\boldsymbol{\theta}) = \frac{1}{m} X^T (X\boldsymbol{\theta} - Y) = 0 $$ $$ X^T X \boldsymbol{\theta} - X^T Y = 0 $$ $$ X^T X \boldsymbol{\theta} = X^T Y $$ Assuming $X^T X$ is invertible (which is usually the case if features are not perfectly linearly dependent and $m \ge n+1$), we can solve for $\boldsymbol{\theta}$: $$ \boldsymbol{\theta} = (X^T X)^{-1} X^T Y $$ - **Advantages**: No need to choose a learning rate. Guaranteed to find the global optimum in one step. - **Disadvantages**: Computing $(X^T X)^{-1}$ involves matrix inversion, which has a computational complexity of $O((n+1)^3)$. This becomes very slow for a large number of features $n$. Requires $X^T X$ to be invertible. ##### B. Gradient Descent Gradient Descent is an iterative optimization algorithm used to find the minimum of a function. For linear regression, it iteratively adjusts the parameters in the direction opposite to the gradient of the cost function. The update rule for each parameter $\theta_j$ is: $$ \theta_j^{\text{new}} = \theta_j^{\text{old}} - \eta \frac{\partial}{\partial \theta_j} J(\boldsymbol{\theta}) $$ where $\eta$ is the learning rate, controlling the size of the steps. Let's derive the partial derivative for $J(\boldsymbol{\theta})$: $$ J(\boldsymbol{\theta}) = \frac{1}{2m} \sum_{i=1}^m (h_\theta(\mathbf{x}^{(i)}) - y^{(i)})^2 $$ For a single parameter $\theta_j$: $$ \frac{\partial}{\partial \theta_j} J(\boldsymbol{\theta}) = \frac{1}{2m} \sum_{i=1}^m \frac{\partial}{\partial \theta_j} (h_\theta(\mathbf{x}^{(i)}) - y^{(i)})^2 $$ $$ = \frac{1}{2m} \sum_{i=1}^m 2 (h_\theta(\mathbf{x}^{(i)}) - y^{(i)}) \frac{\partial}{\partial \theta_j} (h_\theta(\mathbf{x}^{(i)}) - y^{(i)}) $$ Since $h_\theta(\mathbf{x}^{(i)}) = \theta_0 + \theta_1 x_1^{(i)} + \dots + \theta_j x_j^{(i)} + \dots + \theta_n x_n^{(i)}$, then $\frac{\partial}{\partial \theta_j} h_\theta(\mathbf{x}^{(i)}) = x_j^{(i)}$. $$ = \frac{1}{m} \sum_{i=1}^m (h_\theta(\mathbf{x}^{(i)}) - y^{(i)}) x_j^{(i)} $$ So, the update rule for each $\theta_j$ (simultaneously for all $j$): $$ \theta_j \leftarrow \theta_j - \eta \frac{1}{m} \sum_{i=1}^m (h_\theta(\mathbf{x}^{(i)}) - y^{(i)}) x_j^{(i)} $$ This is for **Batch Gradient Descent**, where the gradient is calculated using the entire training set $m$ at each step. - **Variants of Gradient Descent**: - **Batch Gradient Descent**: Uses all $m$ training examples to compute the gradient. Provides stable convergence but can be very slow for large datasets. - **Stochastic Gradient Descent (SGD)**: Updates parameters for each training example individually. $$ \theta_j \leftarrow \theta_j - \eta (h_\theta(\mathbf{x}^{(i)}) - y^{(i)}) x_j^{(i)} \quad \text{for each } i \in 1, \dots, m $$ Much faster than batch GD for large datasets and can escape local minima in non-convex cost functions due to noisy updates, but convergence can be erratic. - **Mini-Batch Gradient Descent**: Updates parameters using a small "mini-batch" of $k$ training examples (e.g., $k = 32, 64, 128$). Combines benefits of batch (stable convergence) and SGD (computational efficiency). Most commonly used approach in deep learning. $$ \theta_j \leftarrow \theta_j - \eta \frac{1}{k} \sum_{i \in \text{mini-batch}} (h_\theta(\mathbf{x}^{(i)}) - y^{(i)}) x_j^{(i)} $$ - **Advantages of Gradient Descent**: Scales well to large numbers of features $n$. Can be used for a wide variety of models. Can handle non-invertible $X^T X$. - **Disadvantages**: Requires careful selection of learning rate $\eta$. Too small, convergence is slow; too large, may overshoot minimum or diverge. Can get stuck in local minima for non-convex cost functions (though MSE for linear regression is convex). #### 2. Non-Linear Regression When the relationship between features and target is not linear, linear regression is insufficient. Non-linear regression models capture these complex relationships. ##### A. K-Nearest Neighbors (KNN) for Regression - **Concept**: KNN is a non-parametric, instance-based learning algorithm. For a new data point, it finds the 'K' closest points in the training data (based on a distance metric, e.g., Euclidean distance) and predicts the average (or median) of their target values. - **Algorithm**: 1. Choose the number of neighbors K. 2. For a new data point $\mathbf{x}_{\text{new}}$, calculate its distance to every point in the training set. 3. Select the K training data points closest to $\mathbf{x}_{\text{new}}$. 4. Predict the output $Y_{\text{new}}$ as the mean of the target values of these K neighbors: $$ Y_{\text{new}} = \frac{1}{K} \sum_{i \in \text{Neighbors}} y_i $$ - **Advantages**: Simple to understand and implement, no training phase (lazy learning), can learn complex non-linear relationships. - **Disadvantages**: Computationally expensive during prediction (needs to calculate distances to all training points), sensitive to choice of K and distance metric, sensitive to irrelevant features, susceptible to the curse of dimensionality. ##### B. Support Vector Machines (SVM) for Regression (SVR) - **Concept**: While primarily known for classification, SVMs can also be extended to regression tasks, known as Support Vector Regression (SVR). Instead of trying to fit the best line through the data (like linear regression), SVR tries to fit the best line within a certain margin of tolerance (epsilon, $\epsilon$) to the target values. - **Goal**: To find a function $f(\mathbf{x}) = \mathbf{w}^T \mathbf{x} + b$ that deviates from the true targets $y$ by no more than $\epsilon$ for all training data, while simultaneously being as flat as possible (i.e., minimizing the norm of the weights, $||\mathbf{w}||^2$). - **$\epsilon$-Insensitive Loss Function**: SVR uses an $\epsilon$-insensitive loss function, which means errors within the $\epsilon$ margin are not penalized. $$ L_\epsilon(y, \hat{y}) = \max(0, |y - \hat{y}| - \epsilon) $$ - **Optimization Problem (Linear SVR)**: Minimize: $$ \frac{1}{2} ||\mathbf{w}||^2 + C \sum_{i=1}^m (\xi_i + \xi_i^*) $$ Subject to: $$ y_i - (\mathbf{w}^T \mathbf{x}_i + b) \le \epsilon + \xi_i $$ $$ (\mathbf{w}^T \mathbf{x}_i + b) - y_i \le \epsilon + \xi_i^* $$ $$ \xi_i, \xi_i^* \ge 0 $$ where $C$ is a regularization parameter, and $\xi_i, \xi_i^*$ are slack variables representing errors above and below the $\epsilon$-tube, respectively. - **Non-Linear SVR with Kernels**: Similar to SVM classification, SVR can handle non-linear relationships by mapping the input data into a higher-dimensional feature space using kernel functions (e.g., Radial Basis Function - RBF kernel, polynomial kernel). In this higher-dimensional space, the relationship might be linear. $$ f(\mathbf{x}) = \mathbf{w}^T \phi(\mathbf{x}) + b $$ where $\phi(\mathbf{x})$ is the kernel trick mapping. - **Advantages**: Robust to outliers (due to $\epsilon$-insensitive loss), effective in high-dimensional spaces, can model non-linear relationships using kernels. - **Disadvantages**: Can be computationally expensive for large datasets, choice of kernel and hyperparameters ($C$, $\epsilon$, $\gamma$) is crucial. ##### C. Decision Trees for Regression - **Concept**: Decision Trees can be used for both classification and regression. For regression, the tree splits the data into subsets based on features, and at each leaf node, it predicts the average (or median) of the target values of the training instances that fall into that leaf. - **Splitting Criterion**: Instead of Gini impurity or entropy (used for classification), regression trees typically use Mean Squared Error (MSE) or Mean Absolute Error (MAE) as the criterion to decide the best split. The goal is to find the split that minimizes the MSE of the targets within the resulting child nodes. - For a split at feature $j$ and threshold $t$, creating regions $R_1$ and $R_2$: $$ J(j, t) = \frac{N_1}{N} \text{MSE}(R_1) + \frac{N_2}{N} \text{MSE}(R_2) $$ where $\text{MSE}(R) = \frac{1}{|R|} \sum_{y_i \in R} (y_i - \bar{y}_R)^2$ and $\bar{y}_R$ is the mean target value in region $R$. - **Prediction**: For a new instance, traverse the tree based on its feature values until a leaf node is reached. The prediction is the average target value of the training instances in that leaf node. - **Advantages**: Easy to understand and interpret, can handle both numerical and categorical data, implicitly performs feature selection, can model complex non-linear relationships. - **Disadvantages**: Prone to overfitting (especially deep trees), can be unstable (small changes in data can lead to different tree structures), generally less accurate than ensemble methods like Random Forests or Gradient Boosting. ##### D. Polynomial Regression - **Concept**: Polynomial regression is a form of linear regression where the relationship between the independent variable $\mathbf{x}$ and the dependent variable $y$ is modeled as an $n$-th degree polynomial. It's still considered a linear model in terms of the coefficients $\boldsymbol{\theta}$, but it can fit non-linear curves to the data. - **Hypothesis**: $$ h_\theta(x) = \theta_0 + \theta_1 x + \theta_2 x^2 + \dots + \theta_d x^d $$ where $d$ is the degree of the polynomial. - **Multiple Features**: Can be extended to multiple features: $$ h_\theta(\mathbf{x}) = \theta_0 + \theta_1 x_1 + \theta_2 x_2 + \theta_3 x_1^2 + \theta_4 x_2^2 + \theta_5 x_1 x_2 + \dots $$ - **Transformation**: To implement polynomial regression, you transform the original features into polynomial features. For example, if you have $x$, you create new features $x^2, x^3, \dots, x^d$. Then, you apply standard linear regression to these transformed features. - **Mathematical Intuition**: By increasing the degree $d$, the model gains more flexibility to fit complex curves. This is essentially feature engineering, where we create non-linear combinations of existing features. - **Advantages**: Can model non-linear relationships, relatively simple to implement. - **Disadvantages**: Prone to overfitting with high polynomial degrees, extrapolation beyond the data range can be unreliable, sensitive to outliers. Choosing the right degree $d$ is crucial. These non-linear regression techniques offer powerful ways to model complex relationships in data, moving beyond the limitations of simple linear assumptions. ### Multilayer Perceptron (MLP) A Multilayer Perceptron (MLP) is a class of feedforward artificial neural networks. It consists of at least three layers of nodes: an input layer, one or more hidden layers, and an output layer. Unlike a single Perceptron, MLPs can learn non-linear relationships, making them capable of solving complex problems like the XOR problem. #### Architecture of an MLP 1. **Input Layer**: - Receives the raw input features ($\mathbf{x}$). - Each node in this layer corresponds to an input feature. - No computation is performed here; they just pass the values to the next layer. 2. **Hidden Layers**: - One or more layers between the input and output layers. - Each node (neuron) in a hidden layer performs a weighted sum of its inputs from the previous layer, adds a bias, and then applies a non-linear activation function. - These layers are responsible for learning complex patterns and representations from the input data. The "deep" in deep learning refers to having many hidden layers. 3. **Output Layer**: - Receives inputs from the last hidden layer. - Each node performs a weighted sum and applies an activation function to produce the final output(s). - The number of nodes and the activation function depend on the task: - **Regression**: Usually one output node with a linear (identity) activation function. - **Binary Classification**: One output node with a sigmoid activation function (outputting probability between 0 and 1). - **Multi-class Classification**: Multiple output nodes (one per class) with a softmax activation function (outputting probabilities for each class). #### Mathematical Model of an MLP Neuron For a neuron $j$ in a hidden layer (or output layer): 1. **Weighted Sum (Net Input) ($z_j$)**: $$ z_j = \sum_{i=1}^N W_{ji} a_i + b_j $$ where: - $a_i$ is the activation (output) of the $i$-th neuron in the previous layer. - $W_{ji}$ is the weight connecting neuron $i$ in the previous layer to neuron $j$ in the current layer. - $b_j$ is the bias term for neuron $j$. - $N$ is the number of neurons in the previous layer. 2. **Activation ($a_j$)**: $$ a_j = f(z_j) $$ where $f$ is the activation function. #### Activation Functions Unlike the step function of a single Perceptron, MLPs use differentiable non-linear activation functions to allow for gradient-based learning. 1. **Sigmoid (Logistic) Function**: $$ f(z) = \frac{1}{1 + e^{-z}} $$ - **Range**: (0, 1). - **Derivative**: $f'(z) = f(z)(1-f(z))$. - **Use**: Historically popular for hidden layers, still used in output layers for binary classification (interpretable as probability). - **Disadvantages**: Vanishing gradients for very large or very small $z$ values, output is not zero-centered, which can slow down gradient descent. 2. **Hyperbolic Tangent (Tanh) Function**: $$ f(z) = \frac{e^z - e^{-z}}{e^z + e^{-z}} $$ - **Range**: (-1, 1). - **Derivative**: $f'(z) = 1 - (f(z))^2$. - **Use**: Often preferred over sigmoid for hidden layers as its output is zero-centered, which can help gradients. - **Disadvantages**: Still suffers from vanishing gradients for large $z$. 3. **Rectified Linear Unit (ReLU) Function**: $$ f(z) = \max(0, z) $$ - **Range**: $[0, \infty)$. - **Derivative**: $$ f'(z) = \begin{cases} 1 & \text{if } z > 0 \\ 0 & \text{if } z ### Classification Classification is a supervised learning task where the goal is to predict a discrete class label for a given input data point. The output variable is categorical. #### Types of Classification 1. **Binary Classification**: Predicts one of two possible classes (e.g., spam/not spam, disease/no disease, true/false). 2. **Multi-Class Classification**: Predicts one of more than two possible classes (e.g., types of animals, digits 0-9, sentiment: positive/negative/neutral). 3. **Multi-Label Classification**: Predicts multiple labels for a single instance (e.g., an image can contain both "cat" and "dog" and "grass"). #### Common Classification Algorithms Many algorithms can be adapted for classification. Here, we highlight some key ones and discuss their principles. ##### 1. Logistic Regression - **Concept**: Despite its name, Logistic Regression is a classification algorithm. It models the probability that a given input belongs to a particular class. It uses the logistic (sigmoid) function to map the linear combination of features to a probability between 0 and 1. - **Hypothesis**: $$ P(Y=1|\mathbf{x}; \boldsymbol{\theta}) = \sigma(\boldsymbol{\theta}^T \mathbf{x}) $$ where $\sigma(z) = \frac{1}{1 + e^{-z}}$ is the sigmoid function. - **Decision Boundary**: By setting $P(\mathbf{x}) = 0.5$, we get $\boldsymbol{\theta}^T \mathbf{x} = 0$, which defines a linear decision boundary. - **Cost Function**: Typically uses Binary Cross-Entropy (Log Loss) for binary classification. - **Optimization**: Gradient Descent is used to minimize the cost function and find optimal $\boldsymbol{\theta}$. - **Advantages**: Simple, interpretable (coefficients can be interpreted as log-odds), computationally efficient, provides probability estimates. - **Disadvantages**: Assumes a linear decision boundary, can struggle with complex non-linear relationships. ##### 2. K-Nearest Neighbors (KNN) for Classification - **Concept**: Similar to KNN for regression, for a new data point, it finds the 'K' closest points in the training data and assigns the class label that is most frequent among these K neighbors (majority vote). - **Algorithm**: 1. Choose the number of neighbors K. 2. For a new data point $\mathbf{x}_{\text{new}}$, calculate its distance to every point in the training set. 3. Select the K training data points closest to $\mathbf{x}_{\text{new}}$. 4. Predict the output $Y_{\text{new}}$ as the majority class among these K neighbors. - **Advantages**: Simple, no training phase, can learn complex non-linear decision boundaries. - **Disadvantages**: Computationally expensive during prediction, sensitive to noise and irrelevant features, susceptible to the curse of dimensionality, requires careful selection of K and distance metric. ##### 3. Decision Trees for Classification - **Concept**: For classification, decision trees split data based on features to create branches, leading to leaf nodes that represent class labels. - **Splitting Criterion**: Uses impurity measures like Gini Impurity or Entropy (Information Gain) to find the best split at each node. The goal is to maximize the homogeneity (purity) of the child nodes. - **Gini Impurity**: For a node $t$, $G(t) = 1 - \sum_{k=1}^C (P_k)^2$, where $P_k$ is the proportion of training instances of class $k$ in node $t$. A split is chosen to minimize the weighted average Gini impurity of the child nodes. - **Entropy**: For a node $t$, $E(t) = - \sum_{k=1}^C P_k \log_2(P_k)$. - **Information Gain (IG)** is used to select the best split: $$ \text{IG}(S, A) = E(S) - \sum_{v \in \text{Values}(A)} \frac{|S_v|}{|S|} E(S_v) $$ where $S$ is the set of examples, $A$ is the feature, $S_v$ is the subset where $A$ has value $v$. - **Prediction**: Traverse the tree based on feature values until a leaf node. The prediction is the majority class of the training instances in that leaf node. - **Advantages**: Interpretable, handles mixed data types, implicitly handles feature selection, can model non-linear boundaries. - **Disadvantages**: Prone to overfitting, can be unstable, tends to create biased trees if some classes dominate. ##### 4. Support Vector Machines (SVM) for Classification - **Concept**: SVM is a powerful algorithm for classification that finds an optimal hyperplane that best separates different classes in the feature space. The "optimal" hyperplane maximizes the margin (the distance between the hyperplane and the closest data points from each class, called support vectors). ###### A. Hard Margin Classification - **Concept**: Assumes the data is perfectly linearly separable. Goal is to find a hyperplane that separates the two classes with the largest possible margin. - **Hyperplane Equation**: A hyperplane can be defined by $\mathbf{w}^T \mathbf{x} + b = 0$. - For a data point $\mathbf{x}$, if $\mathbf{w}^T \mathbf{x} + b > 0$, it belongs to one class (e.g., $y=1$). - If $\mathbf{w}^T \mathbf{x} + b ### Binary Cross-Entropy (BCE) Loss Binary Cross-Entropy (BCE) loss, also known as Log Loss, is a commonly used loss function for binary classification problems. It measures the performance of a classification model whose output is a probability value between 0 and 1. #### Context In binary classification, we typically have two classes, often labeled as 0 and 1. The model predicts the probability that an input belongs to class 1, denoted as $\hat{y}$. The true label is $y$, which can only be 0 or 1. #### Mathematical Derivation BCE loss is derived from the principle of maximum likelihood estimation. Assume we have a Bernoulli distribution for the outcome $y$, given features $\mathbf{x}$ and parameters $\boldsymbol{\theta}$: $$ P(Y=y|\mathbf{x}; \boldsymbol{\theta}) = \hat{y}^y (1-\hat{y})^{1-y} $$ where $\hat{y}$ is the predicted probability of class 1. - If $y=1$, then $P(Y=1|\mathbf{x}; \boldsymbol{\theta}) = \hat{y}^1 (1-\hat{y})^{1-1} = \hat{y}$. - If $y=0$, then $P(Y=0|\mathbf{x}; \boldsymbol{\theta}) = \hat{y}^0 (1-\hat{y})^{1-0} = 1-\hat{y}$. To train a model, we want to maximize the likelihood of observing the true labels given our predictions. For a single training example $(\mathbf{x}, y)$, the likelihood is $P(Y=y|\mathbf{x}; \boldsymbol{\theta})$. It's often easier to work with the log-likelihood (to convert products into sums and avoid numerical underflow): $$ \log P(Y=y|\mathbf{x}; \boldsymbol{\theta}) = \log(\hat{y}^y (1-\hat{y})^{1-y}) = y \log(\hat{y}) + (1-y) \log(1-\hat{y}) $$ To minimize a loss function, we take the negative of the log-likelihood: $$ L(y, \hat{y}) = - [y \log(\hat{y}) + (1-y) \log(1-\hat{y})] $$ This is the Binary Cross-Entropy loss for a single example. For a dataset of $m$ examples, the average BCE loss is: $$ J(\boldsymbol{\theta}) = - \frac{1}{m} \sum_{i=1}^m [y^{(i)} \log(\hat{y}^{(i)}) + (1-y^{(i)}) \log(1-\hat{y}^{(i)})] $$ #### Understanding the Loss Let's analyze the term $- [y \log(\hat{y}) + (1-y) \log(1-\hat{y})]$: - If $y=1$ (true class is 1): The term becomes $- [1 \log(\hat{y}) + (1-1)\log(1-\hat{y})] = - \log(\hat{y})$. - If $\hat{y}$ is close to 1 (correct prediction), $- \log(\hat{y})$ is close to 0 (small loss). - If $\hat{y}$ is close to 0 (incorrect prediction), $- \log(\hat{y})$ approaches $\infty$ (large loss). - If $y=0$ (true class is 0): The term becomes $- [0 \log(\hat{y}) + (1-0)\log(1-\hat{y})] = - \log(1-\hat{y})$. - If $\hat{y}$ is close to 0 (correct prediction), $- \log(1-\hat{y})$ is close to 0 (small loss). - If $\hat{y}$ is close to 1 (incorrect prediction), $- \log(1-\hat{y})$ approaches $\infty$ (large loss). This behavior ensures that the loss penalizes incorrect confident predictions heavily, driving the model to output probabilities that match the true labels. #### Gradient of BCE Loss Let's compute the gradient with respect to the predicted probability $\hat{y}$ for a single example. $$ L(y, \hat{y}) = -y \log(\hat{y}) - (1-y) \log(1-\hat{y}) $$ $$ \frac{\partial L}{\partial \hat{y}} = - \frac{y}{\hat{y}} - (1-y) \frac{1}{1-\hat{y}} (-1) $$ $$ = - \frac{y}{\hat{y}} + \frac{1-y}{1-\hat{y}} = \frac{-y(1-\hat{y}) + \hat{y}(1-y)}{\hat{y}(1-\hat{y})} $$ $$ = \frac{-y + y\hat{y} + \hat{y} - y\hat{y}}{\hat{y}(1-\hat{y})} = \frac{\hat{y} - y}{\hat{y}(1-\hat{y})} $$ This derivative is then used in conjunction with the chain rule during backpropagation to update the model's weights and biases. If the model uses a sigmoid activation function for $\hat{y} = \sigma(z)$, then $\frac{\partial L}{\partial z} = \frac{\partial L}{\partial \hat{y}} \frac{\partial \hat{y}}{\partial z}$. We know $\frac{\partial \hat{y}}{\partial z} = \sigma'(z) = \hat{y}(1-\hat{y})$. So, $\frac{\partial L}{\partial z} = \frac{\hat{y} - y}{\hat{y}(1-\hat{y})} \cdot \hat{y}(1-\hat{y}) = \hat{y} - y$. This simple and elegant derivative is one of the reasons why BCE is so popular with sigmoid outputs in neural networks, simplifying gradient calculations. #### Use Cases - **Binary Classification**: The primary use case (e.g., spam detection, disease prediction, churn prediction). - **Multi-label Classification**: Can be used for each label independently, where each label is a binary classification problem. #### Relationship to Cross-Entropy Binary Cross-Entropy is a special case of Categorical Cross-Entropy for two classes. It also measures the dissimilarity between two probability distributions: the true distribution (a one-hot encoded vector like $[0, 1]$ or $[1, 0]$) and the predicted probability distribution (e.g., $[\hat{y}, 1 - \hat{y}]$). ### Categorical Cross-Entropy (CCE) Loss Categorical Cross-Entropy (CCE) loss is the standard loss function for multi-class classification problems, where each instance belongs to exactly one of several categories. #### Context In multi-class classification, we have $C$ classes. The model outputs a probability distribution over these $C$ classes for each input. The true label is typically represented as a one-hot encoded vector. #### Mathematical Derivation Similar to BCE, CCE is derived from maximum likelihood estimation. Let $\mathbf{y}$ be the true one-hot encoded label vector for an example, where $y_k = 1$ if the true class is $k$ and $y_k = 0$ otherwise. Let $\hat{\mathbf{y}}$ be the predicted probability vector, where $\hat{y}_k$ is the predicted probability that the example belongs to class $k$. These probabilities are usually obtained by applying a softmax activation function to raw scores (logits) from the final layer: $$ \hat{y}_k = P(Y=k|\mathbf{x}; \boldsymbol{\theta}) = \frac{e^{z_k}}{\sum_{j=1}^C e^{z_j}} $$ The likelihood of observing the true label $\mathbf{y}$ for a single example is: $$ P(Y=\mathbf{y}|\mathbf{x}; \boldsymbol{\theta}) = \prod_{k=1}^C (\hat{y}_k)^{y_k} $$ Taking the negative log-likelihood to get the loss function: $$ L(\mathbf{y}, \hat{\mathbf{y}}) = - \log \left(\prod_{k=1}^C (\hat{y}_k)^{y_k} \right) = - \sum_{k=1}^C y_k \log(\hat{y}_k) $$ Since $\mathbf{y}$ is one-hot encoded, only one $y_k$ will be 1 (for the true class), and all others will be 0. So, the sum simplifies to just the term corresponding to the true class. If the true class is $c$: $$ L(\mathbf{y}, \hat{\mathbf{y}}) = - \log(\hat{y}_c) $$ This means the loss is simply the negative logarithm of the predicted probability for the true class. For a dataset of $m$ examples, the average CCE loss is: $$ J(\boldsymbol{\theta}) = - \frac{1}{m} \sum_{i=1}^m \sum_{k=1}^C y_k^{(i)} \log(\hat{y}_k^{(i)}) $$ where $y_k^{(i)}$ is 1 if instance $i$ belongs to class $k$, and 0 otherwise. #### Understanding the Loss - If $\hat{y}_c$ (predicted probability for the true class) is close to 1 (correct and confident prediction), $-\log(\hat{y}_c)$ is close to 0 (small loss). - If $\hat{y}_c$ is close to 0 (incorrect or unconfident prediction), $-\log(\hat{y}_c)$ approaches $\infty$ (large loss). #### Gradient of CCE Loss Let's consider the gradient of the loss with respect to the raw scores (logits) $z_j$ before the softmax activation. This is common in neural network implementations, where softmax and cross-entropy are often combined for numerical stability. For a single example, the loss is $L = - \sum_{k=1}^C y_k \log(\hat{y}_k)$. We want to find $\frac{\partial L}{\partial z_j}$. Using the chain rule: $$ \frac{\partial L}{\partial z_j} = \sum_{k=1}^C \frac{\partial L}{\partial \hat{y}_k} \frac{\partial \hat{y}_k}{\partial z_j} $$ First, $\frac{\partial L}{\partial \hat{y}_k} = - \frac{y_k}{\hat{y}_k}$. Next, we need the derivative of softmax $\hat{y}_k = \frac{e^{z_k}}{\sum_{p=1}^C e^{z_p}}$ with respect to $z_j$. There are two cases: 1. If $k=j$: $$ \frac{\partial \hat{y}_j}{\partial z_j} = \frac{e^{z_j} \sum_{p=1}^C e^{z_p} - e^{z_j} e^{z_j}}{(\sum_{p=1}^C e^{z_p})^2} = \frac{e^{z_j}}{\sum_{p=1}^C e^{z_p}} \left(1-\frac{e^{z_j}}{\sum_{p=1}^C e^{z_p}} \right) = \hat{y}_j (1-\hat{y}_j) $$ 2. If $k \ne j$: $$ \frac{\partial \hat{y}_k}{\partial z_j} = \frac{0 \cdot (\dots) - e^{z_k} e^{z_j}}{(\sum_{p=1}^C e^{z_p})^2} = - \frac{e^{z_k}}{\sum_{p=1}^C e^{z_p}} \frac{e^{z_j}}{\sum_{p=1}^C e^{z_p}} = - \hat{y}_k \hat{y}_j $$ Now, substitute these back into $\frac{\partial L}{\partial z_j}$: $$ \frac{\partial L}{\partial z_j} = \left( - \frac{y_j}{\hat{y}_j} \right) \hat{y}_j (1 - \hat{y}_j) + \sum_{k \ne j} \left(-\frac{y_k}{\hat{y}_k} \right) (-\hat{y}_k \hat{y}_j) $$ $$ = - y_j (1 - \hat{y}_j) + \sum_{k \ne j} y_k \hat{y}_j $$ $$ = - y_j + y_j \hat{y}_j + \sum_{k \ne j} y_k \hat{y}_j $$ Since $y_k$ is 1 for the true class (let's say class $c$) and 0 for others: - If $j=c$: The first term becomes $-1 + \hat{y}_c$. The sum over $k \ne c$ is 0. So, $\hat{y}_c - 1$. - If $j \ne c$: The first term is 0. The sum over $k \ne j$ has only one non-zero term when $k=c$, which is $1 \cdot \hat{y}_j$. So, $\hat{y}_j$. Combining these, the gradient with respect to the logit $z_j$ is simply: $$ \frac{\partial L}{\partial z_j} = \hat{y}_j - y_j $$ This remarkably simple derivative is why softmax with CCE loss is numerically stable and widely used in neural networks for multi-class classification. The error signal is simply the difference between the predicted probability and the true one-hot encoded value for each class. #### Use Cases - **Multi-class Classification**: The primary use case (e.g., image classification into multiple categories, text classification, digit recognition). - **Sparse Categorical Cross-Entropy**: Used when the true labels are integers (0, 1, 2, ...) instead of one-hot encoded vectors. Internally, it still performs a one-hot encoding before calculating the loss. This is computationally more efficient if the number of classes is large. Both BCE and CCE are fundamental loss functions that provide strong gradients to guide the learning process in classification tasks. ### Support Vector Machines (SVM) Support Vector Machines (SVMs) are powerful, versatile machine learning models capable of performing linear or non-linear classification, regression, and even outlier detection. They are particularly well-suited for classification of complex small-to-medium sized datasets. #### 1. Linear SVM Classifier The core idea behind a linear SVM is to find the optimal separating hyperplane that maximizes the margin between different classes in the feature space. ##### A. Hard Margin Classification - **Concept**: Assumes the data is perfectly linearly separable. The goal is to find a hyperplane that separates the two classes with the largest possible margin. - **Hyperplane Equation**: A hyperplane can be defined by $\mathbf{w}^T \mathbf{x} + b = 0$. - For a data point $\mathbf{x}$, if $\mathbf{w}^T \mathbf{x} + b > 0$, it belongs to one class (e.g., $y=1$). - If $\mathbf{w}^T \mathbf{x} + b 0$. ##### B. Common Kernel Functions 1. **Polynomial Kernel**: $$ K(\mathbf{x}_i, \mathbf{x}_j) = (\gamma \mathbf{x}_i^T \mathbf{x}_j + r)^d $$ - $d$: degree of the polynomial. - $\gamma$: scaling parameter. - $r$: constant term. - Creates polynomial decision boundaries. 2. **Radial Basis Function (RBF) Kernel (Gaussian Kernel)**: $$ K(\mathbf{x}_i, \mathbf{x}_j) = \exp(-\gamma ||\mathbf{x}_i - \mathbf{x}_j||^2) $$ - $\gamma$: controls the influence of a single training example. A small $\gamma$ means a large influence (smooth decision boundary), while a large $\gamma$ means a small influence (jagged decision boundary, potential overfitting). - This kernel maps the data into an infinite-dimensional space, allowing highly complex decision boundaries. It is one of the most popular kernels. 3. **Sigmoid Kernel**: $$ K(\mathbf{x}_i, \mathbf{x}_j) = \tanh(\gamma \mathbf{x}_i^T \mathbf{x}_j + r) $$ - Behaves like a two-layer neural network with a sigmoid activation function. 4. **Linear Kernel**: $$ K(\mathbf{x}_i, \mathbf{x}_j) = \mathbf{x}_i^T \mathbf{x}_j $$ - Equivalent to a linear SVM (no kernel trick applied). #### 3. SVM for Regression (SVR) As discussed in the Regression section, SVR uses an $\epsilon$-insensitive loss function to fit the best line within a margin of tolerance, minimizing the norm of weights. It can also use the kernel trick for non-linear regression. #### Advantages of SVMs - **Effective in high-dimensional spaces**: Especially with kernel trick. - **Memory efficient**: Uses a subset of training points (support vectors) in the decision function. - **Versatile**: Can be used for classification, regression, and outlier detection. - **Robust to overfitting**: Due to the margin maximization principle. #### Disadvantages of SVMs - **Computational cost**: Can be slow to train on large datasets (especially with complex kernels), as the training time complexity can be between $O(m^2 n)$ and $O(m^3 n)$ depending on the implementation. - **Parameter tuning**: Requires careful selection of kernel function and hyperparameters ($C, \gamma, d, r$). - **Interpretability**: Black-box nature, especially with non-linear kernels; difficult to interpret the model's decision-making process. - **Scaling**: Not directly provide probability estimates (can be done with Platt scaling, but it adds another layer of computation). SVMs remain a powerful and theoretically elegant algorithm, particularly useful when dealing with complex datasets where the number of features is large relative to the number of samples. ### Radial Basis Function (RBF) Kernel The Radial Basis Function (RBF) kernel, also known as the Gaussian kernel, is one of the most widely used kernel functions in Support Vector Machines (SVMs) and other kernel methods. It allows SVMs to perform non-linear classification and regression by implicitly mapping the input features into an infinite-dimensional feature space. #### Concept of RBF Kernel The RBF kernel measures the similarity between two data points based on their Euclidean distance. It outputs a value between 0 and 1, where 1 indicates identical points and values close to 0 indicate very dissimilar points. #### Mathematical Definition For two data points $\mathbf{x}_i$ and $\mathbf{x}_j$, the RBF kernel function is defined as: $$ K(\mathbf{x}_i, \mathbf{x}_j) = \exp(-\gamma ||\mathbf{x}_i - \mathbf{x}_j||^2) $$ where: - $||\mathbf{x}_i - \mathbf{x}_j||^2$ is the squared Euclidean distance between $\mathbf{x}_i$ and $\mathbf{x}_j$. - $\gamma$ (gamma) is a positive hyperparameter that controls the "reach" or "spread" of the kernel. It is often set to $\frac{1}{2\sigma^2}$, where $\sigma$ is the standard deviation. #### Understanding the Hyperparameter $\gamma$ - **Large $\gamma$**: - Results in a small variance (small $\sigma$), meaning the kernel's influence extends only to data points very close to the support vectors. - The decision boundary becomes more complex and can be highly sensitive to individual data points. - High chance of overfitting the training data. - **Small $\gamma$**: - Results in a large variance (large $\sigma$), meaning the kernel's influence extends to data points further away. - The decision boundary becomes smoother and simpler. - High chance of underfitting the training data. The choice of $\gamma$ is crucial for the performance of RBF SVMs and is typically tuned using cross-validation. #### Implicit Feature Space Mapping The beauty of the RBF kernel (and other kernels) lies in the "kernel trick." While the formula for $K(\mathbf{x}_i, \mathbf{x}_j)$ is simple, it implicitly computes the dot product of the transformed feature vectors $\phi(\mathbf{x}_i)$ and $\phi(\mathbf{x}_j)$ in a very high (often infinite) dimensional feature space. The explicit mapping $\phi(\mathbf{x})$ for the RBF kernel is an infinite-dimensional vector, making it impractical to compute directly. However, the kernel function allows us to work with these higher dimensions without ever explicitly calculating them. This avoids the "curse of dimensionality" that would arise from explicit feature mapping. #### How it Enables Non-Linearity In the original input space, data points that are not linearly separable can often become linearly separable when mapped to a higher-dimensional space. The RBF kernel essentially allows the SVM to find a linear decision boundary in this implicitly transformed, higher-dimensional space, which corresponds to a complex non-linear decision boundary in the original input space. Consider a 1D dataset where points are arranged like O - X - O - X - O. This is not linearly separable. If we map $x \to (x, x^2)$, it might become separable. The RBF kernel performs a much more sophisticated (infinite-dimensional) mapping. #### Use Cases - **Non-linear Classification**: Widely used in image classification, bioinformatics, text categorization, etc., where complex decision boundaries are required. - **Non-linear Regression (SVR)**: Can capture non-linear relationships between features and continuous target variables. - **Density Estimation and Clustering**: Used in kernel density estimation and spectral clustering. #### Advantages of RBF Kernel - **Universal Approximator**: With appropriate parameters, RBF SVMs can model almost any continuous function, making them very powerful. - **Handles non-linear data**: Effectively transforms non-linear problems into linearly separable ones in a higher dimension. - **Relatively few hyperparameters**: Primarily C (regularization) and $\gamma$ (kernel spread). #### Disadvantages of RBF Kernel - **Hyperparameter sensitivity**: Performance heavily depends on the correct tuning of C and $\gamma$. - **Computational cost**: Can be slow for very large datasets, as the kernel matrix needs to be computed. - **Interpretability**: The implicit high-dimensional mapping makes it difficult to interpret the model's decision process. - **Scaling**: Requires feature scaling (e.g., standardization) because the Euclidean distance is sensitive to feature ranges. If features have very different scales, features with larger scales might dominate the distance calculation. The RBF kernel is a cornerstone of non-linear SVMs, enabling them to solve a broad range of complex real-world problems by leveraging the power of implicit high-dimensional transformations. ### Information Gain (IG) Information Gain is a key concept in decision tree algorithms, particularly ID3 and C4.5, used to select the best attribute (feature) for splitting a node. It quantifies the expected reduction in entropy (or impurity) caused by splitting a dataset based on an attribute. The attribute with the highest information gain is chosen as the split criterion. #### 1. Entropy Entropy is a measure of the impurity or randomness in a set of data. In the context of classification, it measures the uncertainty of a target variable's class distribution. - **Definition**: For a given set $S$ of training examples, if $P_k$ is the proportion of examples in $S$ that belong to class $k$, the entropy of $S$ is defined as: $$ E(S) = - \sum_{k=1}^C P_k \log_2(P_k) $$ where $C$ is the number of classes. - **Properties**: - If all examples in $S$ belong to the same class (pure node), $P_k=1$ for one class and $P_k=0$ for others. $E(S) = -1 \log_2(1) = 0$. (Minimum entropy, maximum purity). - If examples are equally distributed among classes (maximum impurity), e.g., for two classes, $P_1=0.5, P_2=0.5$. $E(S) = -(0.5 \log_2(0.5) + 0.5 \log_2(0.5)) = - (0.5 \cdot -1 + 0.5 \cdot -1) = 1$. (Maximum entropy, minimum purity). - The higher the entropy, the more impure or uncertain the set. #### 2. Information Gain Information Gain is the reduction in entropy achieved by splitting a dataset $S$ on a particular attribute $A$. It tells us how much "information" an attribute provides about the class labels. - **Definition**: $$ \text{IG}(S, A) = E(S) - \sum_{v \in \text{Values}(A)} \frac{|S_v|}{|S|} E(S_v) $$ where: - $S$: The current set of examples (parent node). - $A$: The attribute being considered for the split. - $\text{Values}(A)$: The set of all possible values for attribute $A$. - $S_v$: The subset of examples in $S$ where attribute $A$ has value $v$. - $|S|$: The total number of examples in set $S$. - $|S_v|$: The number of examples in subset $S_v$. - $E(S_v)$: The entropy of the subset $S_v$. The term $\sum_{v \in \text{Values}(A)} \frac{|S_v|}{|S|} E(S_v)$ is the weighted average entropy of the child nodes after the split, often called Remainder or Conditional Entropy. - **Interpretation**: Information Gain calculates the difference between the entropy of the parent node and the weighted average entropy of the child nodes. A higher Information Gain means the attribute $A$ is better at separating the data into purer subsets. #### Example Calculation (Binary Classification) Suppose we have a dataset $S$ with 14 instances: 9 positive (P) and 5 negative (N). $E(S) = -\left(\frac{9}{14} \log_2\left(\frac{9}{14}\right) + \frac{5}{14} \log_2\left(\frac{5}{14}\right)\right) \approx 0.940$ bits. Now, consider splitting on an attribute "Outlook" with values "Sunny", "Overcast", "Rain". - Outlook = Sunny: 5 instances (2P, 3N). $E(S_{\text{Sunny}}) = -\left(\frac{2}{5} \log_2\left(\frac{2}{5}\right) + \frac{3}{5} \log_2\left(\frac{3}{5}\right)\right) \approx 0.971$. - Outlook = Overcast: 4 instances (4P, 0N). $E(S_{\text{Overcast}}) = -\left(\frac{4}{4} \log_2\left(\frac{4}{4}\right) + \frac{0}{4} \log_2\left(\frac{0}{4}\right)\right) = 0$ (perfectly pure). - Outlook = Rain: 5 instances (3P, 2N). $E(S_{\text{Rain}}) = -\left(\frac{3}{5} \log_2\left(\frac{3}{5}\right) + \frac{2}{5} \log_2\left(\frac{2}{5}\right)\right) \approx 0.971$. Weighted average entropy of child nodes (Remainder): $$ \text{Remainder}(\text{Outlook}) = \frac{5}{14} E(S_{\text{Sunny}}) + \frac{4}{14} E(S_{\text{Overcast}}) + \frac{5}{14} E(S_{\text{Rain}}) $$ $$ = \frac{5}{14}(0.971) + \frac{4}{14}(0) + \frac{5}{14}(0.971) \approx 0.693 $$ Information Gain for "Outlook": $$ \text{IG}(S, \text{Outlook}) = E(S) - \text{Remainder}(\text{Outlook}) = 0.940 - 0.693 = 0.247 $$ The decision tree algorithm would calculate IG for all available attributes and choose the one with the highest IG as the root split. #### Limitations of Information Gain Information Gain has a bias towards attributes that have a large number of distinct values. An attribute with many unique values (e.g., an ID number) would likely produce many small, pure child nodes, resulting in a very high Information Gain. However, such a split might not generalize well to unseen data and leads to overfitting. #### Gain Ratio To overcome this bias, C4.5 algorithm uses Gain Ratio. Gain Ratio normalizes Information Gain by the "Split Information" (or Intrinsic Value) of the attribute, which measures the breadth and uniformity of the split. $$ \text{SplitInfo}(S, A) = - \sum_{v \in \text{Values}(A)} \frac{|S_v|}{|S|} \log_2\left(\frac{|S_v|}{|S|}\right) $$ $$ \text{GainRatio}(S, A) = \frac{\text{IG}(S, A)}{\text{SplitInfo}(S, A)} $$ Attributes with a large number of values will have a high SplitInfo, which will reduce their Gain Ratio, thus penalizing attributes that create many small branches. Information Gain (and its variants like Gini Impurity used in CART) is fundamental to how decision trees construct their hierarchical structures, aiming to create nodes that are as pure as possible with respect to the target variable. ### Ensembling Ensembling is a powerful technique in machine learning where multiple models (called "base learners" or "weak learners") are combined to solve the same problem. The core idea is that by combining the predictions of several models, the ensemble model can achieve better performance and robustness than any single constituent model. #### Why Ensemble? - **Reduce Variance**: By averaging predictions, ensembles can reduce the impact of individual model errors and noise, leading to more stable and robust predictions. - **Reduce Bias**: Some ensemble methods can combine weak learners to produce a strong learner that can model complex relationships, effectively reducing bias. - **Improve Accuracy**: Often leads to higher predictive accuracy than individual models. - **Robustness**: Less sensitive to the peculiarities of individual datasets or choices of initial parameters. #### Types of Ensemble Methods Ensemble methods are generally categorized into two main groups: 1. **Parallel Ensemble Methods** (e.g., Bagging, Random Forest): Base learners are trained independently. The final prediction is typically an average (for regression) or a majority vote (for classification) of individual predictions. Aims to reduce variance. 2. **Sequential Ensemble Methods** (e.g., Boosting, AdaBoost, Gradient Boosting): Base learners are trained sequentially, where each new model tries to correct the errors of the previous ones. Aims to reduce bias. #### 1. Bagging (Bootstrap Aggregating) - **Concept**: Bagging involves training multiple instances of the same learning algorithm on different bootstrap samples (random samples with replacement) of the training data. - **Process**: 1. **Bootstrapping**: Create $N$ new training datasets by sampling *with replacement* from the original training dataset. Each new dataset will be roughly the same size as the original but will contain some duplicate instances and omit others (out-of-bag instances). 2. **Base Model Training**: Train a separate base learner (e.g., a decision tree) on each of these $N$ bootstrap samples. 3. **Aggregation**: - **Classification**: The final prediction is determined by a majority vote among the $N$ base learners. - **Regression**: The final prediction is the average of the predictions from the $N$ base learners. - **Key Idea**: Reduces variance by averaging (or voting) over models trained on slightly different data, making the ensemble less sensitive to the specific training data. - **Advantages**: Reduces overfitting, improves stability and accuracy, can be parallelized. - **Disadvantages**: Can be computationally intensive for many base models, less interpretable than single models. - **Example**: Random Forest. #### 2. Random Forest - **Concept**: An extension of bagging that uses decision trees as base learners. It introduces additional randomness to the tree building process. - **Process**: 1. **Bagging**: As in bagging, multiple bootstrap samples are created. 2. **Random Feature Subspace**: When growing each decision tree, at each split point, instead of considering all available features, only a random subset of features is considered. This decorrelates the trees. 3. **Tree Building**: Each tree is grown to its maximum depth without pruning (to ensure low bias for individual trees). 4. **Aggregation**: Predictions are combined by majority vote (classification) or averaging (regression). - **Key Idea**: The two sources of randomness (bootstrap sampling and random feature subsetting) ensure that the individual trees are diverse, reducing the overall variance of the ensemble and making it less prone to overfitting. - **Advantages**: High accuracy, robust to overfitting, handles high-dimensional data, performs implicit feature selection, provides feature importance estimates. - **Disadvantages**: Less interpretable than single decision trees, can be computationally intensive, requires tuning of hyperparameters (number of trees, number of features to sample at each split). #### 3. Boosting - **Concept**: Boosting is a sequential ensemble method where base learners are trained iteratively. Each new base learner focuses on correcting the errors made by the previous ones. - **Key Idea**: Transforms weak learners into a strong learner by adaptively changing the weights of training instances or residuals after each iteration. - **Advantages**: Often achieves very high accuracy, reduces bias. - **Disadvantages**: More prone to overfitting than bagging if not carefully tuned, sequential nature makes parallelization difficult, sensitive to noisy data and outliers. - **Examples**: AdaBoost, Gradient Boosting (GBM), XGBoost, LightGBM, CatBoost. ##### A. AdaBoost (Adaptive Boosting) - **Concept**: The first successful boosting algorithm. It focuses on misclassified training instances by increasing their weights in subsequent iterations. - **Process (for classification)**: 1. Initialize equal weights for all training instances. 2. For $t = 1, \dots, T$ (number of iterations/base learners): a. Train a weak learner (e.g., a shallow decision tree, called a "stump") on the current weighted dataset. b. Calculate the error rate of this weak learner. c. Calculate the "importance" (alpha value) of this weak learner based on its error rate. More accurate learners get higher importance. d. Update the weights of the training instances: Increase weights for misclassified instances, decrease weights for correctly classified instances. This makes subsequent learners focus more on the "hard" examples. 3. **Final Prediction**: A weighted majority vote of all weak learners, where weights are their importance values. - **Mathematical Intuition**: Each weak learner $h_t(\mathbf{x})$ is trained to minimize the weighted error. The final classifier is $H(\mathbf{x}) = \text{sign}(\sum_{t=1}^T \alpha_t h_t(\mathbf{x}))$. ##### B. Gradient Boosting (GBM) - **Concept**: A more generalized boosting algorithm that builds new base learners that predict the residuals (errors) of the previous ensemble. - **Process**: 1. Start with an initial model (e.g., a constant prediction for regression, or log-odds for classification). 2. For $t = 1, \dots, T$: a. Compute the "pseudo-residuals" (gradients of the loss function with respect to the current ensemble's predictions). For regression with MSE, these are simply the actual residuals ($y - \hat{y}$). b. Train a new weak learner (e.g., a decision tree) to predict these pseudo-residuals. c. Add this new learner's prediction to the ensemble, scaled by a learning rate, to update the overall prediction. 3. **Final Prediction**: Sum of predictions from all base learners. - **Key Idea**: It tries to iteratively reduce the loss function by adding models that move in the direction of the negative gradient of the loss. - **Advantages**: Highly accurate, flexible (can use various loss functions and base learners), state-of-the-art performance on many tabular datasets. - **Disadvantages**: Prone to overfitting if not tuned, computationally intensive, sensitive to noisy data. - **Advanced Variants**: XGBoost, LightGBM, CatBoost are highly optimized and regularized implementations of gradient boosting that offer significant performance improvements. #### 4. Stacking (Stacked Generalization) - **Concept**: A more complex ensemble method where multiple base models (level-0 models) are trained on the data, and then a meta-model (level-1 model) is trained on the predictions of the base models. - **Process**: 1. **Level-0 Models**: Train several diverse base learners on the training data. 2. **Meta-Feature Generation**: The predictions of these level-0 models on the training data (often generated using cross-validation to avoid data leakage) serve as the input features for the meta-model. 3. **Level-1 Model (Meta-learner)**: Train a separate model (e.g., Logistic Regression, Ridge Regression, or a simple neural network) on these meta-features to make the final prediction. - **Key Idea**: Allows the meta-model to learn how to best combine the predictions of the base models, often by learning their strengths and weaknesses. - **Advantages**: Can achieve very high accuracy by leveraging the strengths of different models, often outperforms bagging and boosting. - **Disadvantages**: Complex to implement, computationally expensive (requires training multiple models and cross-validation), risk of overfitting the meta-model if not careful. Ensemble methods are fundamental to achieving high performance in many real-world machine learning applications and are a crucial part of any data scientist's toolkit. ### Principal Component Analysis (PCA) Principal Component Analysis (PCA) is a widely used unsupervised learning technique for dimensionality reduction. Its primary goal is to transform a high-dimensional dataset into a lower-dimensional one while retaining as much of the original variance (information) as possible. #### 1. Motivation for Dimensionality Reduction - **Curse of Dimensionality**: In high-dimensional spaces, data becomes sparse, making it difficult for learning algorithms to find patterns. - **Noise Reduction**: High-dimensional data often contains redundant or noisy features, which can hinder model performance. - **Visualization**: Difficult to visualize data with more than 3 dimensions. PCA can reduce dimensions to 2 or 3 for plotting. - **Computational Efficiency**: Reducing the number of features can significantly speed up training time for subsequent machine learning algorithms. - **Storage Space**: Less memory required to store the data. #### 2. Core Idea of PCA PCA identifies directions (principal components) in the data where the variance is maximized. These principal components are orthogonal to each other, meaning they are uncorrelated. The first principal component captures the most variance, the second captures the next most variance orthogonal to the first, and so on. #### 3. Mathematical Steps of PCA Given a dataset $X$ with $m$ samples and $n$ features. $$ X = \begin{pmatrix} x_{11} & x_{12} & \dots & x_{1n} \\ x_{21} & x_{22} & \dots & x_{2n} \\ \vdots & \vdots & \ddots & \vdots \\ x_{m1} & x_{m2} & \dots & x_{mn} \end{pmatrix} $$ ##### Step 1: Standardize the Data It's crucial to standardize the data before applying PCA. Features with larger scales might dominate the principal components. For each feature $j$: $$ x_{ij}^{\text{scaled}} = \frac{x_{ij} - \mu_j}{\sigma_j} $$ where $\mu_j$ is the mean of feature $j$ and $\sigma_j$ is the standard deviation of feature $j$. After standardization, the mean of each feature is 0, and the standard deviation is 1. ##### Step 2: Compute the Covariance Matrix The covariance matrix $\Sigma$ (often denoted $C$) of the scaled data describes the relationships between all pairs of features. For a dataset $X$ where each column is a feature (and is already mean-centered), the covariance matrix is given by: $$ \Sigma = \frac{1}{m-1} X^T X $$ - The diagonal elements $\Sigma_{jj}$ represent the variance of feature $j$. - The off-diagonal elements $\Sigma_{jk}$ represent the covariance between feature $j$ and feature $k$. - Positive covariance: features increase/decrease together. - Negative covariance: one feature increases, the other decreases. - Zero covariance: features are uncorrelated. ##### Step 3: Compute Eigenvectors and Eigenvalues of the Covariance Matrix Eigenvectors and eigenvalues are central to PCA. - **Eigenvectors**: Represent the directions (principal components) along which the data varies the most. They are the new axes. - **Eigenvalues**: Represent the magnitude of variance along their corresponding eigenvector. A larger eigenvalue means more variance is captured along that principal component. For a square matrix $A$ (here, $\Sigma$), an eigenvector $\mathbf{v}$ and its corresponding eigenvalue $\lambda$ satisfy: $$ \Sigma \mathbf{v} = \lambda \mathbf{v} $$ We solve this equation for all $\mathbf{v}$ and $\lambda$. The covariance matrix is symmetric, so its eigenvectors are orthogonal. ##### Step 4: Sort Eigenvectors by Decreasing Eigenvalues Order the eigenvectors from highest to lowest corresponding eigenvalue. The eigenvector with the highest eigenvalue is the first principal component, the one with the second highest is the second principal component, and so on. ##### Step 5: Select a Subset of Principal Components Choose the top $k$ eigenvectors (principal components) that correspond to the largest eigenvalues. These $k$ eigenvectors will form a new feature subspace. The number $k$ is the desired dimensionality of the reduced data ($k \le n$). The choice of $k$ can be based on: - **Explained Variance Ratio**: Calculate the proportion of variance explained by each principal component: $\frac{\lambda_j}{\sum_{i=1}^n \lambda_i}$. Then sum these ratios for the top $k$ components to achieve a desired cumulative explained variance (e.g., 95%). - **Scree Plot**: Plot eigenvalues in decreasing order and look for an "elbow" point where the eigenvalues drop off sharply. ##### Step 6: Project Data onto the New Feature Subspace Form a projection matrix $W$ by taking the top $k$ eigenvectors and arranging them as columns. $$ W = [\mathbf{v}_1, \mathbf{v}_2, \dots, \mathbf{v}_k] $$ The new, reduced-dimensional dataset $Z$ is obtained by multiplying the original (scaled) data matrix $X_{\text{scaled}}$ by $W$: $$ Z = X_{\text{scaled}} W $$ The new matrix $Z$ will have dimensions $m \times k$, where each column represents a principal component. #### Example: 2D to 1D PCA Imagine 2D data points forming an elongated cloud. 1. Center the data. 2. Compute covariance matrix. 3. Find eigenvectors: one aligned with the longest axis of the cloud (direction of most variance), another orthogonal to it. 4. The eigenvalue for the first eigenvector will be much larger. 5. Select only the first eigenvector. 6. Project all 2D points onto this 1D line defined by the first eigenvector. The data is now 1D, having lost the least amount of information. #### Advantages of PCA - **Dimensionality Reduction**: Reduces the number of features, combating the curse of dimensionality. - **Noise Reduction**: By focusing on directions of highest variance, PCA often filters out noise present in less significant dimensions. - **Decorrelation**: Transforms correlated features into a set of uncorrelated features (principal components). - **Visualization**: Enables visualization of high-dimensional data in 2 or 3 dimensions. #### Disadvantages of PCA - **Loss of Information**: Reduces dimensionality by discarding some variance, which means some information is lost (though ideally, the least important information). - **Interpretability**: Principal components are linear combinations of original features, making them less interpretable than the original features. - **Assumes Linearity**: PCA is a linear transformation. It may not perform well if the data has complex non-linear structures (for which non-linear dimensionality reduction techniques like t-SNE or UMAP might be better). - **Sensitive to Feature Scaling**: Requires proper data standardization. - **Not Feature Selection**: It combines features rather than selecting a subset of original features. PCA is a fundamental tool in data analysis and machine learning, particularly useful for preprocessing high-dimensional data before applying other algorithms.