Mechanical Properties of Materials
Cheatsheet Content
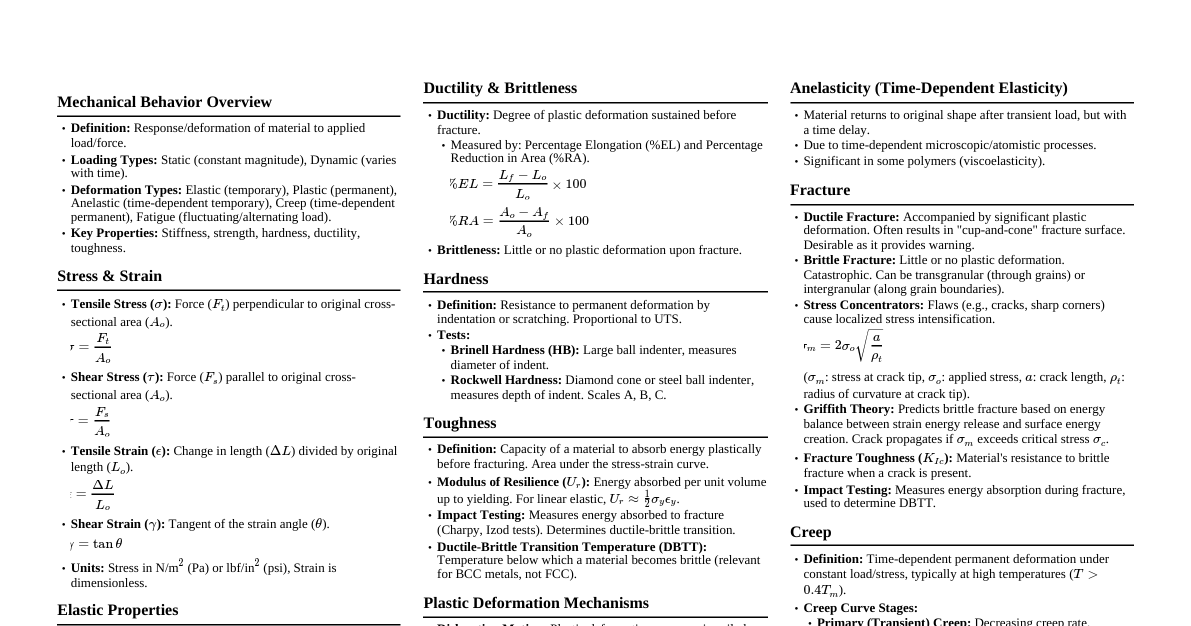
1. Introduction to Mechanical Properties Materials deform (elongate, compress, twist) or break under applied loads. Tensile tests are widely used to obtain basic design information on strength. Parameters from stress-strain curve: tensile strength, yield strength/point, percent elongation, reduction of area. Strength parameters: tensile strength, yield strength. Ductility indicators: percent elongation, reduction of area. 2. Concepts of Stress and Strain 2.1. Engineering Stress ($\sigma$) Defined as the ratio of perpendicular force applied to a specimen divided by its original cross-sectional area. Formula: $\sigma = \frac{F}{A_0}$ Units: Megapascal (MPa) = $10^6 \, \text{Newtons/m}^2$ 2.2. Engineering Strain ($\epsilon$) Ratio of change in length due to deformation to the original length of the specimen. Formula: $\epsilon = \frac{l_i - l_0}{l_0} = \frac{\Delta l}{l_0}$ Unitless, often expressed as m/m or mm/mm. Represents average linear strain. 3. Stress-Strain Behavior 3.1. Hooke's Law (Elastic Region) For materials stressed in tension at low levels, stress and strain are proportional: $\sigma = E\epsilon$ Constant E: Modulus of Elasticity (Young's Modulus). Measured in MPa. Ranges from $\sim 4.5 \times 10^4$ to $40 \times 10^7$ MPa. Formula: $E = \frac{F/A}{\Delta l/l}$ Elastic Deformation: If stress is removed within the linear region, material returns to original shape. Elastic Limit: Lowest stress at which permanent deformation can be measured. Proportional Limit: Point where stress-strain curve becomes non-linear. 3.2. Typical Stress-Strain Curve Regions A stress-strain curve generally exhibits the following regions: Elastic Region: Linear relationship, material returns to original shape. Yielding: Material begins to plastically deform. Strain Hardening: Stress increases with increasing plastic strain. Necking and Failure: Cross-sectional area decreases locally (necking), leading to fracture. Stress Strain Elastic Yielding Strain Hardening Necking Proportional Limit Elastic Limit Yield Stress Ultimate Stress Fracture 4. Material Behavior Classification 4.1. Ductile Materials Withstand large strains before rupture. Yielding region often takes up majority of stress-strain curve. Absorb more energy before failure (larger area under $\sigma-\epsilon$ curve). Examples: Steel, aluminum. 4.2. Brittle Materials Fracture at much lower strains. Yielding region is nearly nonexistent. Fail suddenly with little warning. Often have large Young's moduli and ultimate stresses compared to ductile materials. Examples: Glass, ceramics, cast iron. Ductile $\epsilon$ $\sigma$ Brittle $\epsilon$ $\sigma$ 5. Yield Strength Stress at which a material begins to plastically deform. Beyond yield point, deformation becomes permanent. Offset Yield Point (Proof Stress): Defined as the stress at some arbitrary plastic strain (e.g., 0.2%). Determined by the intersection of a line offset from the linear elastic region by the required strain. Commonly used for design and specifications. Formula: $R_{p0.2} = \frac{P_{(\text{strain offset}=0.002)}}{A_0}$ 6. Elastic Properties of Materials When stress is removed, the material returns to its original dimension. Deformation is reversible and non-permanent. Poisson's Ratio ($\nu$): Ratio of lateral strain to axial strain. Formula: $\nu = -\frac{\epsilon_x}{\epsilon_z} = -\frac{\epsilon_y}{\epsilon_z}$ For isotropic materials, $\nu \approx 0.25$. Maximum theoretical value is $0.5$. Most metals: $0.25$ to $0.35$. Relationship between Elastic Modulus (E), Shear Modulus (G), and Poisson's Ratio ($\nu$): Formula: $E = 2G(1 + \nu)$ 7. Plastic Deformation Permanent, irreversible deformation after stress is removed. Occurs when elastic limit is exceeded. For metallic materials, elastic deformation typically occurs up to strains of about $0.005$. Beyond this, plastic deformation occurs. Caused by slip , where atomic bonds are broken by dislocation motion and new bonds are formed. 8. Anelasticity Elastic behavior, but stress-strain curve is not immediately reversible. Strain takes time to return to zero after load removal. Small effect for metals, significant for polymers. 9. Tensile Strength Maximum stress a material can withstand before necking and fracture. Also known as Ultimate Tensile Strength (UTS). Formula: $R_m = \frac{P_{max}}{A_0}$ For ductile metals, yield strength is often more critical for design than tensile strength. 10. Ductility Ability of a material to deform plastically before fracture. Opposite of brittleness. Measured by: Percent maximum elongation ($e_{max}$): Engineering strain at fracture, $e_f = \frac{L_f - L_0}{L_0}$. Reduction of area ($q$): $q = \frac{A_0 - A_f}{A_0}$. Indicates material's ability to flow plastically and accommodate stress concentrations. 11. Resilience Ability of a material to absorb energy when deformed elastically and return it upon unloading. Represented by the area under the elastic region of the stress-strain curve. Modulus of Resilience ($U_r$): Strain energy per unit volume required to stress material from zero stress to yield stress. Formula: $U_r = \frac{\sigma^2}{2E} = 0.5\sigma\epsilon = 0.5\sigma\left(\frac{\sigma}{E}\right)$ For uniaxial tension: $U_r = \frac{1}{2}\sigma_x\epsilon_x$ Material E, psi $s_0$, psi $U_r$ Medium-carbon steel $30 \times 10^6$ $45000$ $33.7$ High-carbon spring steel $30 \times 10^6$ $140000$ $320$ Duraluminium $10.5 \times 10^6$ $18000$ $17.0$ Copper $16 \times 10^6$ $4000$ $5.3$ Rubber $150$ $300$ $300$ Acrylic polymer $0.5 \times 10^6$ $2000$ $4.0$ 12. Toughness Energy a material can absorb before rupture (area under the entire stress-strain curve). Resistance of a material to crack propagation. Combines strength and ductility. A tough material has both high strength and high ductility. Influenced by: Strain rate (rate of loading) Temperature Notch effect Impact Toughness: Measured by Charpy or Izod tests, determining energy absorbed during fracture. Notch-Toughness: Ability to absorb energy in the presence of a flaw (notch/crack). Flaws induce triaxial tension stress, restricting plastic deformation and promoting brittle failure. Fracture Toughness ($K_{Ic}$): Property describing ability of a material containing a crack to resist fracture. Units: MPa$\sqrt{\text{m}}$. Mode I crack opening (tensile loading normal to crack plane) is most common. Stress-intensity factor: $K_I = \sigma\sqrt{\pi a}\beta$ $\sigma$: applied stress $a$: crack length $\beta$: dimensionless factor for crack length and component geometry 13. True Stress and True Strain Engineering Stress/Strain: Based on original cross-sectional area ($A_0$) and original length ($L_0$). $\sigma_E = P/A_0$ $\epsilon_E = \Delta l/l_0$ True Stress ($\sigma_T$): Ratio of applied load (P) to the instantaneous cross-sectional area (A). $\sigma_T = P/A$ Relationship to engineering stress (assuming constant volume): $\sigma_T = \sigma_E(1 + \epsilon_E)$ True Strain ($\epsilon_T$): Sum of all instantaneous engineering strains. $\epsilon_T = \int_{l_0}^{l_f} \frac{dl}{l} = \ln\left(\frac{l_f}{l_0}\right)$ Relationship to engineering strain: $\epsilon_T = \ln(1 + \epsilon_E)$ Flow Curve: True stress-true strain curve, representing basic plastic flow characteristics. Strain Hardening Exponent ($n$) and Strength Coefficient (K): Describes flow curve in uniform plastic deformation: $\sigma = K\epsilon^n$ 14. Elastic Recovery During Plastic Deformation If a material is loaded beyond its yield point and then unloaded, it retains a permanent strain. Upon reloading, it behaves elastically up to a new, higher yield point (strain hardening). Elastic Strain Recovery: The amount of elastic strain a material can undergo before reaching the yield point. 15. Hardness Resistance to plastic deformation (e.g., dent, scratch). Well correlated with tensile strength. Measured by standard tests involving indentation (e.g., Rockwell, Brinell, Vickers, Knoop). Mohs Hardness Test: Empirical scale based on scratch resistance. Brinell Hardness Test: Uses a hardened sphere indenter; hardness number (HB) is load divided by surface area of indentation. Rockwell Hardness Test: Measures depth of impression from a specified indenter (steel ball or diamond cone) under minor and major loads. Vickers and Knoop Microhardness Tests: Used for thin films or surface hardness; use small diamond pyramid indenters (square for Vickers, rhombic for Knoop) under low loads. Scleroscope and Rebound Hardness Tests: Measure rebound height of a dropped hammer. Durometer Hardness Test: Measures indentation hardness for rubbers/elastomers and soft plastics. Barcol Hardness Test: Measures penetration of a sharp steel point under spring load for rigid plastics. 16. Theoretical and Practical Strength Theoretical Strength ($\sigma_{th}$): Maximum stress of a pure, ideal material without defects. Represents stress to break atomic bonds. Dependent on material characteristics (E, $a$, $\gamma$). Formula: $\sigma_{th} = \sqrt{\frac{E\gamma}{a}}$ Practical Strength ($\sigma_p$): Actual strength of engineering materials with defects (pores, flaws, cracks). Defects cause stress concentration, reducing strength. Formula: $\sigma_p = \sqrt{\frac{EG}{\pi c}}$ $E$: Young's modulus $G$: Fracture toughness $c$: crack length Engineers aim to minimize cracks to enhance practical strength.