Data Science & Big Data Intro
Cheatsheet Content
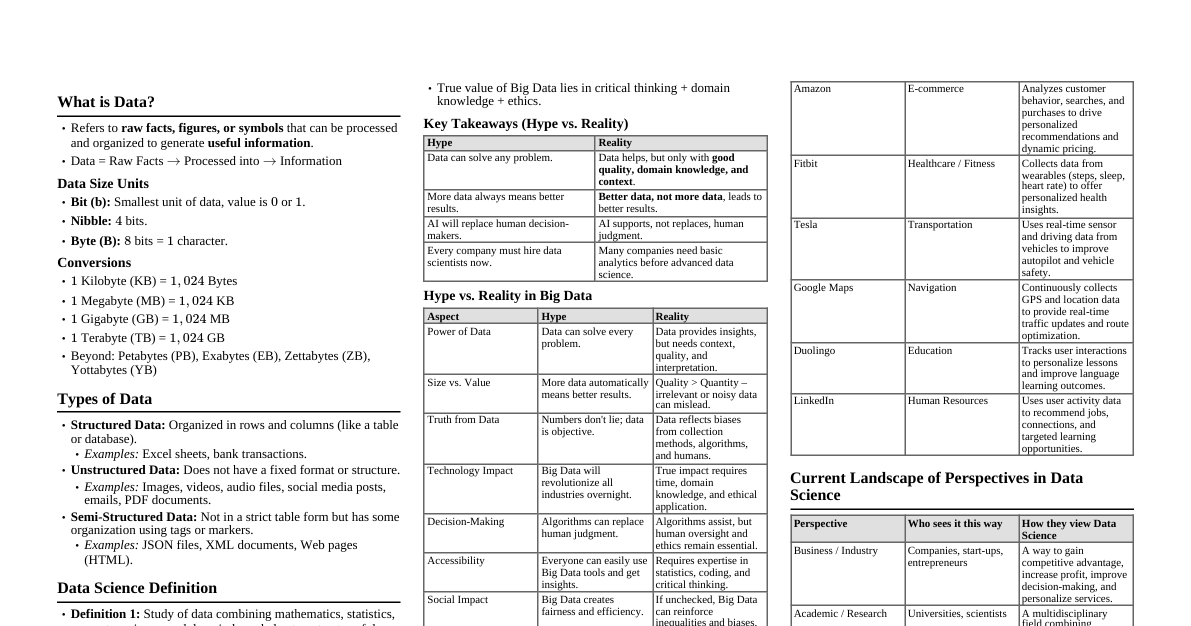
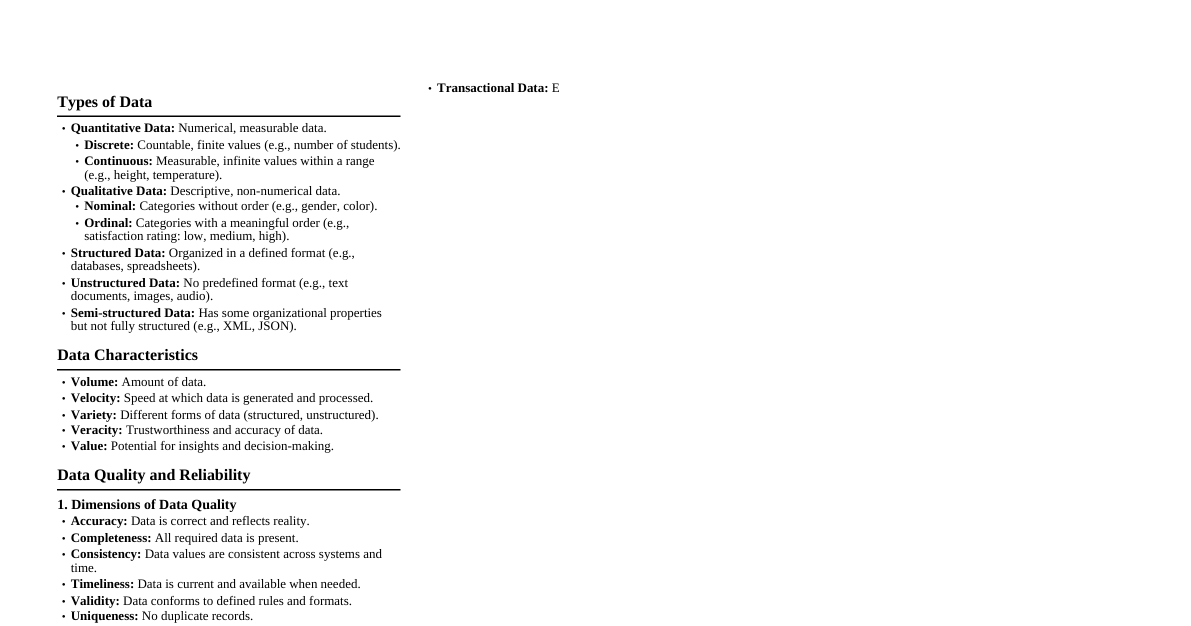
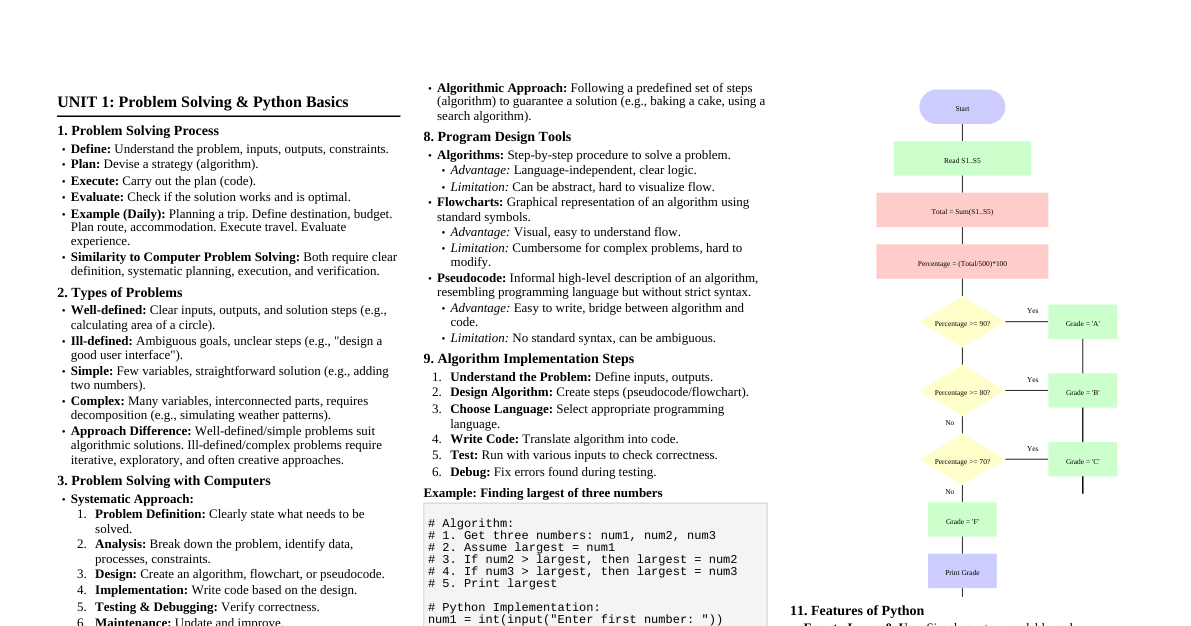
What is Data? Definition: Raw facts and information. Can be numbers, text, images, videos, sounds, or even clicks. Examples: Your name, age, phone number = data. "I ate 2 sandwiches today" $\rightarrow$ (2 = data, sandwiches = data). A photo on Instagram $\rightarrow$ image data. Google Maps tracking your location $\rightarrow$ location data. Data is just information collected from the world around us. What is Science in Data Science? Science: Using systematic methods (experiments, analysis, observation) to find patterns, prove facts, and make decisions. In Data Science, we apply scientific methods (like statistics, computer algorithms, machine learning) to data. Example: Scientist in a lab $\rightarrow$ experiments with chemicals to find medicine. Data Scientist $\rightarrow$ experiments with data to find insights. Data Science The art + science of turning raw information into useful knowledge and smarter decisions. Data Science is like being a detective who uses data to solve problems. Example: A shopkeeper learns chips sell more in the evening, cold drinks in summer, and uses this to make better decisions. Types of Data Qualitative (Categorical) Data Describes qualities or characteristics, cannot be measured numerically. Nominal Data: Categories with no inherent order or ranking. Examples: Hair color, gender, city of origin. Ordinal Data: Categories with a distinct, natural order or ranking, but lacks a precise numerical scale. Examples: Likert scales ("strongly agree", "agree"), sizes (small, medium, large), race finishing positions. Quantitative (Numerical) Data Involves numbers and measures quantities. Discrete Data: Exact, distinct values that can be counted, with gaps between possible values. Examples: Number of cars on a road, number of students in a class. Continuous Data: Can take on any value within a given range, measured infinitely, with no gaps. Examples: Height, weight, temperature. What is Big Data? So much data that normal computers can't handle it easily. Examples: WhatsApp $\rightarrow$ billions of messages daily. Google Maps $\rightarrow$ live traffic from millions of phones. Amazon $\rightarrow$ millions of products bought at the same time. Analogy: Normal Data = Small fish tank (easy to manage); Big Data = Entire ocean (needs ships, submarines, radars). Data Science vs Big Data Data Science: Brain (analyzes & finds patterns). Big Data: Body (huge amount of information). Together, they power the apps we use daily. Benefits of Data Science Better Decisions: Businesses know what customers like $\rightarrow$ stock products accordingly. Predictions: Weather forecasting (rain, storm, heat). Automation: Google Photos automatically recognizes faces. Personalization: Netflix recommends shows based on your watch history. Problem Solving: Hospitals detect diseases early with patient data. Uses of Data Science (Real-life Applications) Healthcare: Predicting diseases, drug discovery. Banking & Finance: Fraud detection, loan approval. E-commerce: Product recommendations, demand forecasting. Transport: Google Maps, Uber ride pricing. Social Media: Instagram feed, YouTube recommendations. Agriculture: Crop prediction, smart irrigation. Benefits of Big Data Handles Huge Information: Billions of records every second. Real-time Insights: Google Maps shows traffic live. Detect Patterns: Amazon notices what people are buying together. Cost Saving: Companies optimize storage and resources. Competitive Advantage: Businesses know customers better. Uses of Big Data Retail: Track customer buying behavior, predict purchases, manage stock. Healthcare: Store and analyze millions of medical records. Government: Population census, public safety, smart cities. Education: Analyzing student performance data. Sports: Player performance analysis, match predictions. Facets of Data (The V's of Data) To explain Big Data, we often use "V's of Data": Volume: Huge amount of data (WhatsApp messages). Velocity: Speed of data (live stock prices). Variety: Different types of data (text, video, images). Veracity: Trustworthiness of data (fake news vs. real news). Value: Useful insights from data (Netflix suggestions). Analogy (Restaurant): Volume: Number of customers. Velocity: Speed of food orders. Variety: Different cuisines (Indian, Chinese, Italian). Veracity: Are orders accurate? Value: Profit you get from serving them. What is Structured Data? Data that is organized in rows and columns , like in an Excel sheet or database. Easy to store, search, and analyze. Has a fixed format (name, age, phone number). Examples: Student marks in a table (Name, Subject, Score). ATM transaction records (Date, Amount, Account No). Employee details (ID, Salary, Department). Name Age Marks Ravi 20 85 Neha 21 90 Arjun 19 78 What is Unstructured Data? Data that does not follow a fixed format . Difficult to put into rows/columns. Needs special tools to analyze (like AI, machine learning). Examples: A photo on Instagram. A WhatsApp voice note. A movie on Netflix. Tweets or Facebook comments. Random text messages: message in short(like,gm,tk, etc) A 2-hour video $\rightarrow$ can't fit in a simple Excel table. Analogy: Structured Data = A well-organized library; Unstructured Data = A messy room. Highlight difference: Human data is expressive but messy, machine data is exact, precise and structured. Natural Language Data Definition: Data created by humans when they speak or write in natural languages (like English, Hindi, Spanish). Characteristics: Informal, full of emotions, sometimes unclear. Examples: Chat messages on WhatsApp. Tweets on Twitter. Customer reviews on Amazon. Machine-Generated Data Definition: Data automatically produced by machines, devices, or software without direct human typing. Characteristics: Precise, structured, often very large in volume. Examples: Data from Google Maps about traffic. Heart rate readings from a smartwatch. Temperature records from a weather station. Graph or Network Data Definition: Data that represents relationships or connections. Examples: Facebook friend connections. Metro map showing stations and routes. Airline routes between cities. Key idea: Focuses on links/relationships, not just individual items. Real-Life Example: Instagram suggests "People you may know" $\rightarrow$ Based on network connections. Audio Data Definition: Sound recordings stored as data. Examples: Voice notes on WhatsApp. Songs on Spotify. Call recordings in customer service. Key idea: Contains patterns of sound waves. Real-Life Example: Voice command to Alexa or Google Assistant. Image Data Definition: Pictures stored in digital form. Examples: Selfies on your phone. X-ray scans in hospitals. Photos on Instagram. Key idea: Made of pixels (tiny dots of colors). Real-Life Example: Facial recognition in phone unlocking. Video Data Definition: A sequence of images (frames) with sound, played continuously. Examples: YouTube videos. CCTV footage. Online classes recordings. Key idea: Combination of image + audio, shown over time. Real-Life Example: Watching a movie on Netflix. Streaming Data Definition: Data that is continuously generated in real-time. Examples: Live cricket score updates. Netflix movie streaming. Stock market price changes. Key idea: Data flows continuously, not in one fixed file. Real-Life Example: Uber showing your cab moving live on the map. The Data Science Process Step 1: Define the Problem Ask: "What are we trying to solve?" Example: A shop owner wants to know which products sell best. Step 2: Collect Data Gather information from different sources. Example: Collect past sales records, customer feedback, or online orders. Step 3: Clean and Prepare Data Raw data is messy (missing values, duplicates, errors). Example: Customer wrote "N/A" for phone number $\rightarrow$ Fix or remove. Analogy: Like washing vegetables before cooking. Step 4: Explore and Analyze Data Look for patterns and trends. Example: Check which products sell more in winter vs summer. Analogy: Like tasting food while cooking to see if it's okay. Step 5: Build a Model (Prediction/Insights) Use tools/algorithms to make predictions. Example: Predict which customers may buy more in the future. Analogy: Like following a recipe to get the final dish. Step 6: Interpret & Communicate Results Explain findings in simple language so decision-makers understand. Example: Tell shop owner: "Winter jackets sell $3x$ more in November-December." Step 7: Take Action & Improve Use results to make better decisions. Example: Stock more jackets before winter. Continuous process $\rightarrow$ Repeat for new problems. Big Data Ecosystem Definition: A collection of tools, technologies, and frameworks to store, process, and analyze very large and complex data. Analogy: Like a city ecosystem – you need roads, electricity, water, markets $\rightarrow$ all work together. Similarly, in Big Data you need storage, processing, analysis, and visualization tools. Examples: Storage: HDFS (Hadoop Distributed File System) Processing: Hadoop, Spark Databases: NoSQL (MongoDB, Cassandra) Visualization: Tableau, Power BI Distributed File Systems (DFS) Definition: A way of storing data across multiple computers so they work together as one big storage system. Why needed? One computer cannot handle petabytes of data. Analogy: Imagine a big library – one room cannot store all books, so books are distributed across many rooms, but you can still search as if it's one library. Examples: HDFS (Hadoop Distributed File System): Used by many big data platforms. Google File System (GFS): Used by Google. Distributed Programming Framework What does it mean? Distributed: Work is shared among many computers. Programming framework: A set of tools that makes it easier for programmers to write and manage code. Together $\rightarrow$ Distributed Programming Framework: Tools that help us break a big problem into smaller parts, process them on different computers at the same time, and then combine the results. Why do we need it? A single computer has limits (storage, speed). Companies like Google, Amazon, Netflix need to process huge amounts of data (billions of searches, transactions, videos). Distributed frameworks allow them to use hundreds or thousands of computers together like a team. Hadoop Hadoop is a framework that uses distributed storage and parallel processing to store and manage big data. Three components of Hadoop: Hadoop HDFS: Hadoop Distributed File System (HDFS) is the storage unit. Hadoop MapReduce: Hadoop MapReduce is the processing unit. Hadoop YARN: Yet Another Resource Negotiator (YARN) is a resource management unit. Key Benefits: Faster processing. Handles massive data (bigger than one computer can store). Scalable $\rightarrow$ you can add more computers anytime. Data Integration Framework What does it mean? Data integration: Bringing data from different places together into one view. Framework: Ready-made tools that make this job easier. Together $\rightarrow$ Data Integration Framework: Tools that help collect, clean, and merge data from multiple sources so it can be used effectively. Why do we need it? Data is stored in many formats and locations (databases, Excel sheets, cloud, apps, sensors). To make better decisions, we need to see all the data in one place. Without integration, data is scattered, messy, and hard to use. What is a GPU? GPU stands for Graphics Processing Unit . It is like a special brain inside your computer (or phone, or gaming console) that is very good at handling lots of calculations at the same time . Originally, GPUs were built for graphics (to make images, animations, and games look smooth). Today, they are also used for AI, machine learning, data science, and big data , because they can process huge amounts of data very quickly. Relational Database A relational database organizes data into tables (rows & columns). Each table stores data about a specific subject (e.g., Students, Courses, Employees). Tables are connected by relationships (keys). Managed using SQL (Structured Query Language). No SQL Databases NoSQL = "Not Only SQL" Unlike traditional relational databases (RDBMS) that use tables and rows, NoSQL databases are designed to handle: Big Data Unstructured / Semi-structured data High scalability and flexibility They don't strictly follow the table-row-column model. Scheduling Tools Tools that help manage time, tasks, and resources efficiently. They can be manual (calendars, charts) or software-based (apps, automation tools). Used in project management, IT, business operations, and personal productivity. Examples: Project Scheduling Tools: Microsoft Project, Jira Calendar & Meeting Scheduling Tools: Google Calendar, Microsoft Outlook Calendar Workflow Scheduling Tools: Apache Airflow, Odoo Benchmarking Tools Benchmarking: Measuring the performance of a system (computer, database, network, application, etc.) against a standard or competitor. It helps check speed, efficiency, reliability, and scalability. Examples: HammerDB, Iometer, Apache JMeter