Foundations of Data Science
Cheatsheet Content
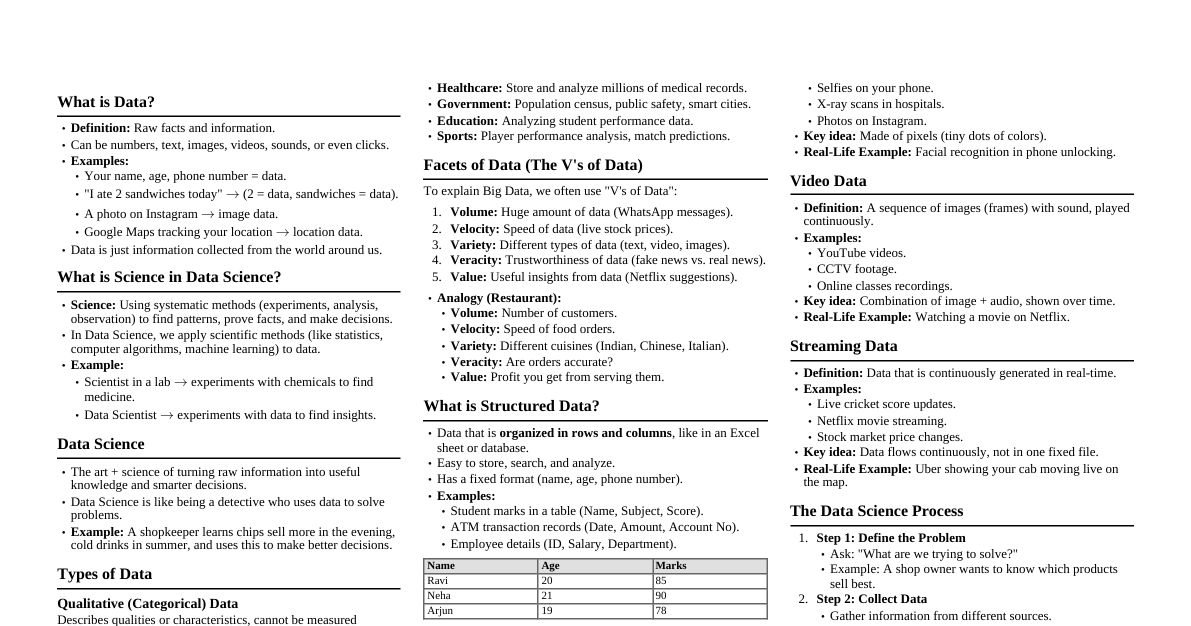
What is Data? Refers to raw facts, figures, or symbols that can be processed and organized to generate useful information . Data = Raw Facts $\rightarrow$ Processed into $\rightarrow$ Information Data Size Units Bit (b): Smallest unit of data, value is $0$ or $1$. Nibble: $4$ bits. Byte (B): $8$ bits = $1$ character. Conversions $1$ Kilobyte (KB) = $1,024$ Bytes $1$ Megabyte (MB) = $1,024$ KB $1$ Gigabyte (GB) = $1,024$ MB $1$ Terabyte (TB) = $1,024$ GB Beyond: Petabytes (PB), Exabytes (EB), Zettabytes (ZB), Yottabytes (YB) Types of Data Structured Data: Organized in rows and columns (like a table or database). Examples: Excel sheets, bank transactions. Unstructured Data: Does not have a fixed format or structure. Examples: Images, videos, audio files, social media posts, emails, PDF documents. Semi-Structured Data: Not in a strict table form but has some organization using tags or markers. Examples: JSON files, XML documents, Web pages (HTML). Data Science Definition Definition 1: Study of data combining mathematics, statistics, computer science, and domain knowledge to extract useful information, find patterns, and aid decision-making. Definition 2: Interdisciplinary field employing scientific methods, processes, algorithms, and computational techniques to analyze structured and unstructured data to extract actionable insights, knowledge discovery, and informed decision-making. Data Science = Data + Algorithms + Insights + Decision Making Definition 4: "Data Science is about using automated methods to analyze massive amounts of data and to extract knowledge from them. By combining aspects of statistics, computer science, applied mathematics, and domain expertise, data science turns data into actionable insights." Big Data and Data Science Hype Big Data: Extremely large datasets generated from digital interactions (social media, sensors, transactions, health records, IoT). Promises: Predicting trends, improving efficiency, personalizing experiences. 5 V's of Big Data Volume: Huge amount of data. Variety: Different formats of data from various sources. Velocity: High speed of accumulation of data. Veracity: Inconsistencies and uncertainty in data. Value: Extract useful data. The Hype Big Data marketed as a "magic solution". Common claims: "Data can replace intuition", "Bigger is always better", "More data = more truth". Over-promises from companies, media, and tech enthusiasts. Why Data Science Became Hyped? Explosive Data Growth: Massive increase in data production, revealing hidden potential value. Success Stories in Tech Giants: Companies like Google, Amazon, Netflix showed how data-driven decision-making transforms business. AI & Machine Learning Breakthroughs: Rapid progress created impression that data science can solve almost any problem. High Salaries and Job Demand: Media hype ("Data Scientist: The Sexiest Job of the 21st Century") boosted interest. Widespread Adoption Across Industries: From healthcare to finance, every sector invested in data analytics. Authors' Perspective on Hype Cathy O'Neil: Warns against blind trust in algorithms, highlights risks of bias, discrimination, and opacity in Big Data. Rachel Schutt: Emphasizes realistic expectations, advocates for proper statistical foundations and skepticism, focuses on responsible and ethical use of data. Moving Beyond the Hype Set clear goals. Focus on data quality. Integrate domain expertise with technical skills. Understand ethical and privacy concerns. The Reality Check Data $\neq$ automatic insights (requires cleaning, context, and modeling). Quality matters more than quantity. Algorithms can reinforce societal inequalities if unchecked. True value of Big Data lies in critical thinking + domain knowledge + ethics. Key Takeaways (Hype vs. Reality) Hype Reality Data can solve any problem. Data helps, but only with good quality, domain knowledge, and context . More data always means better results. Better data, not more data , leads to better results. AI will replace human decision-makers. AI supports, not replaces, human judgment. Every company must hire data scientists now. Many companies need basic analytics before advanced data science. Hype vs. Reality in Big Data Aspect Hype Reality Power of Data Data can solve every problem. Data provides insights, but needs context, quality, and interpretation. Size vs. Value More data automatically means better results. Quality > Quantity – irrelevant or noisy data can mislead. Truth from Data Numbers don't lie; data is objective. Data reflects biases from collection methods, algorithms, and humans. Technology Impact Big Data will revolutionize all industries overnight. True impact requires time, domain knowledge, and ethical application. Decision-Making Algorithms can replace human judgment. Algorithms assist, but human oversight and ethics remain essential. Accessibility Everyone can easily use Big Data tools and get insights. Requires expertise in statistics, coding, and critical thinking. Social Impact Big Data creates fairness and efficiency. If unchecked, Big Data can reinforce inequalities and biases. Getting Past the Hype in Data Science Focus on Problems, Not Just Data Build the Basics First Use Domain Knowledge Measure Value, Not Buzzwords Be Aware of Limits and Ethics Build a Data-Driven Culture Real-World Applications of Data Science Healthcare Finance E-commerce & Marketing Transportation What is Datafication? Turning everyday activities, behaviors, and interactions into data that can be collected, stored, and analyzed. Examples: Social media posts $\rightarrow$ data about moods, trends, interests. Fitness trackers / smartwatches $\rightarrow$ steps, heart rate, sleep data. E-commerce browsing $\rightarrow$ clicks, searches, purchases become data. Smart home devices $\rightarrow$ energy use, voice commands, routines data. Education platforms $\rightarrow$ attendance, assignment submissions, learning patterns. Why Datafication Matters? Provides huge new sources of data for analysis and decision-making. Helps organizations predict behavior and personalize experiences. Enables data-driven innovation in fields like healthcare, transportation, marketing, and education. Benefits of Datafication Enables evidence-based decision making. Helps create personalized user experiences. Allows predictive modeling of future events. Supports automation in industries and cities. Provides real-time insights from continuous data streams. Challenges of Datafication Privacy and security concerns (personal data collection). Ethical issues (consent, surveillance, data misuse). Data overload (collecting data without knowing how to use it). REAL-WORLD $\rightarrow$ DATAFICATION $\rightarrow$ DATA SCIENCE $\rightarrow$ ANALYTICS $\rightarrow$ INSIGHTS $\rightarrow$ DECISIONS Key Idea of Datafication Datafication is the fuel of the Data Science era — it creates the raw material (data) that data scientists analyze to produce insights. Daily activities $\rightarrow$ data $\rightarrow$ analysis $\rightarrow$ insights Real-World Case Studies of Datafication Company Area What They Do (Datafication in Action) Netflix Entertainment Tracks viewing patterns to recommend shows, optimize content production, and reduce churn. Amazon E-commerce Analyzes customer behavior, searches, and purchases to drive personalized recommendations and dynamic pricing. Fitbit Healthcare / Fitness Collects data from wearables (steps, sleep, heart rate) to offer personalized health insights. Tesla Transportation Uses real-time sensor and driving data from vehicles to improve autopilot and vehicle safety. Google Maps Navigation Continuously collects GPS and location data to provide real-time traffic updates and route optimization. Duolingo Education Tracks user interactions to personalize lessons and improve language learning outcomes. LinkedIn Human Resources Uses user activity data to recommend jobs, connections, and targeted learning opportunities. Current Landscape of Perspectives in Data Science Perspective Who sees it this way How they view Data Science Business / Industry Companies, start-ups, entrepreneurs A way to gain competitive advantage, increase profit, improve decision-making, and personalize services. Academic / Research Universities, scientists A multidisciplinary field combining statistics, computer science, and domain knowledge to create new methods and theories. Engineering / Technology Data engineers, software developers A technical challenge involving data infrastructure, storage, and scalable systems to handle big data. Social / Ethical Policy makers, legal experts, public Focus on privacy, fairness, transparency, and responsible AI, ensuring data use doesn't harm society. Government / Public Sector Governments, NGOs A tool to improve governance, policy-making, and citizen services using public data responsibly. Individual / Personal General public, consumers A part of daily life through social media, smart devices, and apps – often without realizing they are generating data. Summary of Perspectives Business: "Data as profit and strategy." Academic: "Data as a scientific field." Engineering: "Data as a technical challenge." Government: "Data as a tool for better services." Social/Ethical: "Data as something to regulate responsibly." Individuals: "Data as part of daily life." Statistical Inference Process of drawing conclusions or making predictions about a population, based on data collected from a sample of that population. Populations and Samples In statistics, understanding the difference between a population and a sample is fundamental to data analysis and inference. Population: The entire set of items from which data is drawn in a statistical study. Can be a group of individuals or a set of items. Usually denoted by $N$. Sample: A subset of the population selected for study. A representative portion of the population used to make inferences or draw conclusions about the entire population. Usually denoted by $n$. Example: Teacher's Height Study A teacher wants to know the average height of all students in her college (population). It's not practical to measure every student, so she collects a sample of $50$ students. From the sample, she finds the average height = $165$ cm. She also calculates the $95\%$ confidence interval = $[162$ cm, $168$ cm$]$. Key Definitions Population: Entire collection of things under consideration. Parameter: A summary measure computed to describe a characteristic of the population. Sample: A portion of the population selected for analysis. Statistic: A summary measure computed to describe a characteristic of the sample. Statistical Modeling Process of using statistical techniques to describe, analyze, and make predictions about relationships and patterns within data. Involves formulating mathematical models to represent the underlying structure of data and capturing relationships between variables. Used to test hypotheses, make predictions, and infer information about populations based on sample data. Types of Statistical Models Linear Regression Models: Model relationship between one or more independent variables and a continuous dependent variable. Logistic Regression Models: Used for binary classification problems where the dependent variable is binary or categorical. Time Series Models: Analyze and forecast time-dependent data (e.g., autoregressive (AR), moving average (MA), ARIMA). Generalized Linear Models (GLMs): Extensions of linear regression models for non-normal response variables and non-constant variance. Survival Analysis Models: Analyze time-to-event data (e.g., Kaplan-Meier estimation, Cox proportional hazards models). Dependent vs Independent Variables in Regression Dependent Variable (Response / Output / Target): The variable we want to predict or explain. Its value depends on other variables. Independent Variables (Predictors / Features / Inputs): The variables used to predict the dependent variable. They are assumed to influence or explain the dependent variable. Real-World Examples Housing Prices Regression: Dependent variable: House Price ($\$$). Independent variables: Number of rooms, square footage, location, age of house. Student Performance Regression: Dependent variable: Final Exam Score. Independent variables: Hours studied, attendance, number of assignments completed. Business Sales Regression: Dependent variable: Monthly Sales Revenue. Independent variables: Advertising spend, product price, seasonal factors. Key Difference: Inference vs. Modeling Inference: Making conclusions about the population from the sample. ("What can we conclude about the population?") Modeling: Creating a mathematical representation of relationships in data. ("How can we explain or predict using data?") Statistical Inference vs. Statistical Modeling Aspect Statistical Inference Statistical Modeling Definition Drawing conclusions about a population from a sample. Building mathematical models to describe relationships among variables. Goal Generalization: estimate unknown parameters, test hypotheses. Explanation & Prediction: understand structure and forecast outcomes. Focus Estimation, confidence intervals, hypothesis testing. Representing relationships, predicting new values. Tools/Methods t-tests, z-tests, chi-square test, ANOVA, confidence intervals. Regression (linear, logistic), time series (ARIMA), multivariate models (PCA, factor analysis). Output Probabilistic statements (e.g., "mean study hours is $6 \pm 0.5$ hours"). Mathematical equations or algorithms (e.g., "StudyHours $= 2 + 0.8 \times$ SleepHours"). Data Use Mostly sample $\rightarrow$ infer population. Uses sample data to build a model, often for future prediction. Example Concluding whether girls study more than boys in the university (hypothesis test). Building a regression model linking study hours with sleep and attendance. Probability Distribution Describes how probabilities are assigned to possible outcomes of a random variable. If random variable is discrete $\rightarrow$ lists probabilities of each possible value. If random variable is continuous $\rightarrow$ gives a probability density function (PDF) that describes likelihood across values. Types of Probability Distributions Discrete Distributions: Outcomes take specific countable values ($0, 1, 2, ...$). Bernoulli Distribution: Single trial with 2 outcomes (success/failure, $0$ or $1$). Example: Tossing a coin (Head = $1$, Tail = $0$). Binomial Distribution: Number of successes in a fixed number of independent trials. Example: Probability of getting exactly $3$ heads in $5$ coin tosses. Poisson Distribution: Number of events occurring in a fixed time/space interval. Example: Number of emails received per hour. Geometric Distribution: Probability of getting the first success on the $k$-th trial. Example: How many dice rolls until you get a six. Continuous Distributions: Outcomes take any value within a range. Normal (Gaussian) Distribution: Bell-shaped, symmetric around the mean. Example: Heights or weights of people in a population. Uniform Distribution: All outcomes in the interval are equally likely. Example: Probability of choosing a random number between $1$ and $10$. Exponential Distribution: Time between consecutive events in a Poisson process. Example: Time until the next customer enters a shop. Chi-Square Distribution: Distribution of sum of squared standard normal variables. Example: Used in hypothesis testing (e.g., goodness-of-fit test). t-Distribution: Similar to normal distribution but with heavier tails. Example: Estimating mean when sample size is small. Summary of Distributions Bernoulli: One trial (Yes/No). Binomial: Multiple trials. Poisson: Event counts over time/space. Normal: Natural measurements (height, weight). Exponential: Waiting times. Uniform: All outcomes equally likely. Fitting a Model & Overfitting Fitting a Model: Choosing a model form (e.g., linear, logistic, decision tree) and estimating parameters so that the model approximates the relationship in observed data. Goal: Capture the underlying pattern (signal) to predict or generalize to new/unseen data. Key steps: Define hypothesis space, select features, choose estimation method, evaluate fit (training error, validation error). Underfitting Definition: Model is too simple to capture the underlying patterns in data. Symptoms: High error on training data and test data; model fails to learn important relationships. Cause: Too few features, overly simple model, not enough training time. Real-World Example: Predicting housing prices using only "number of rooms", ignoring location, size, amenities. Overfitting Definition: Model is too complex, capturing noise (random fluctuations, idiosyncrasies) as well as the actual signal in the training data. These models perform very well on training data but poorly on new/unseen data because they've "memorized" training samples rather than learned general rules. Signs: Very low training error (near zero), but much higher validation/test error. Model complexity increases (many parameters, deep trees, high-degree polynomials), improving fit on training data but degrading on unseen data. Poor performance when deployed. Causes: Too many features/parameters relative to data amount, noisy data or irrelevant features, overly complex model structure, inadequate validation, no regularization. How to Prevent / Mitigate Overfitting? Train-validation/test split: Hold out data not seen during training to test generalization. Cross-validation: Use k-fold CV for more robust estimates of model performance. Regularization: Penalize large/complex parameter values (L1, L2, ridge, lasso). Feature selection: Use only meaningful features; drop irrelevant/noisy ones. Simpler model: Prefer simpler models if they perform nearly as well (Occam's razor). Early stopping: In iterative training, stop before over-training. Ensemble methods / averaging: Combining simpler models to reduce variance. Example of Overfitting A complex model (deep decision tree, many interaction terms) gets $95-100\%$ $R^2$ on training data, but performance drops to $50-60\%$ on test data. This is overfitting. A simpler linear regression might have slightly lower training performance ($80\%$) but much better test/generalization ($75-80\%$), which is better in practice. Hold-Out Method Idea: Split dataset into two parts: Training set: Build the model. Test set: Evaluate generalization. Typical split: $70\%$ train / $30\%$ test (sometimes $80/20$). Advantage: Simple & fast. Limitation: Performance estimate may vary depending on which data goes into training/test. Real-World Example: Predicting housing prices – use $7,000$ houses for training, keep $3,000$ unseen houses aside to test accuracy. Cross-Validation (General Idea) A technique to reduce variance in model evaluation. Instead of one split, data is split into multiple folds, and the model is trained/tested multiple times. Helps get a more reliable estimate of performance. K-Fold Cross-Validation Process: Divide dataset into $K$ equal folds. Train model on $K-1$ folds, test on the remaining fold. Repeat $K$ times (each fold serves as test once). Take the average performance as the final score. Common choice: $K = 5$ or $10$. Advantage: Uses all data for both training and testing; reduces bias. Limitation: More computationally expensive. Real-World Example: Email spam detection model – use $10$-fold cross-validation on $10,000$ labeled emails. Each round: $9,000$ emails train, $1,000$ test. Final accuracy = average of $10$ test results $\rightarrow$ more reliable estimate. Training and Testing Split Percentages $80\%$ Training / $20\%$ Testing: Widely used for reasonably sized datasets; provides robust evaluation of generalization. $70\%$ Training / $30\%$ Testing: Another popular choice, offering a slightly larger test set. $67\%$ Training / $33\%$ Testing: Encountered in some statistical contexts. $50\%$ Training / $50\%$ Testing: Less common, used for specific scenarios or smaller datasets where maximizing test set size is desired. According to ChatGPT: $70\%$ Training / $30\%$ Testing: Most common in small-medium datasets. $80\%$ Training / $20\%$ Testing: Often used with more data (preferred default). $90\%$ Training / $10\%$ Testing: Used when dataset is very large, as $10\%$ is enough for testing. Validation Set: Many practitioners keep a third set for validation: Training: $60\%$ Validation: $20\%$ Testing: $20\%$