Mathematics Part I Formulas
Shared 1/13/2026•186 views
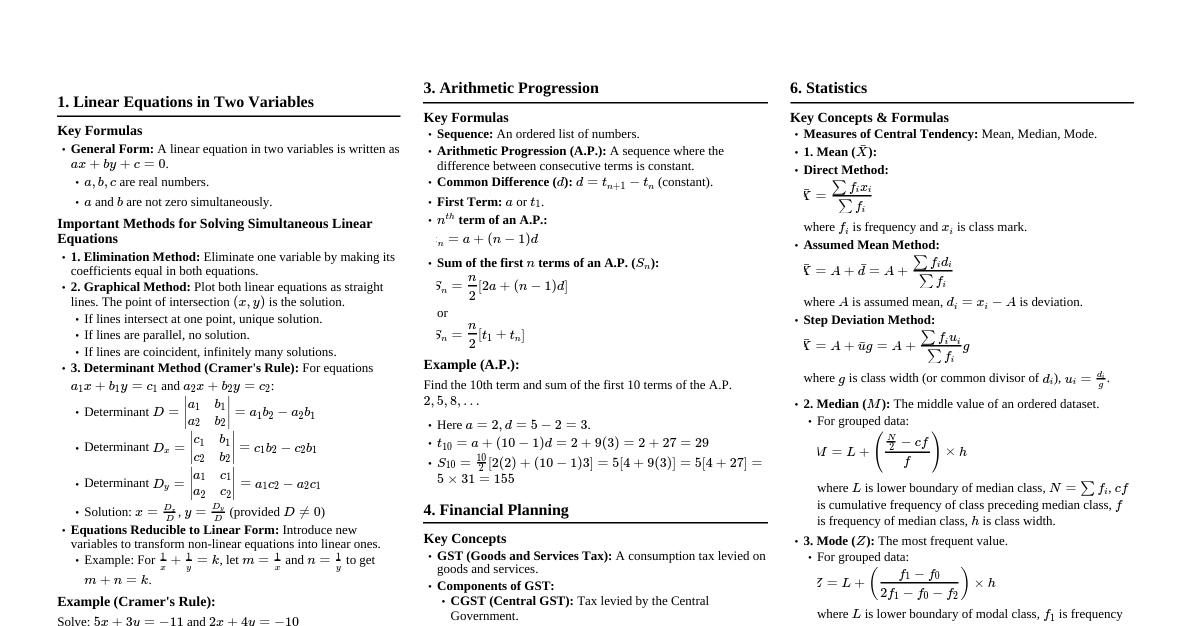
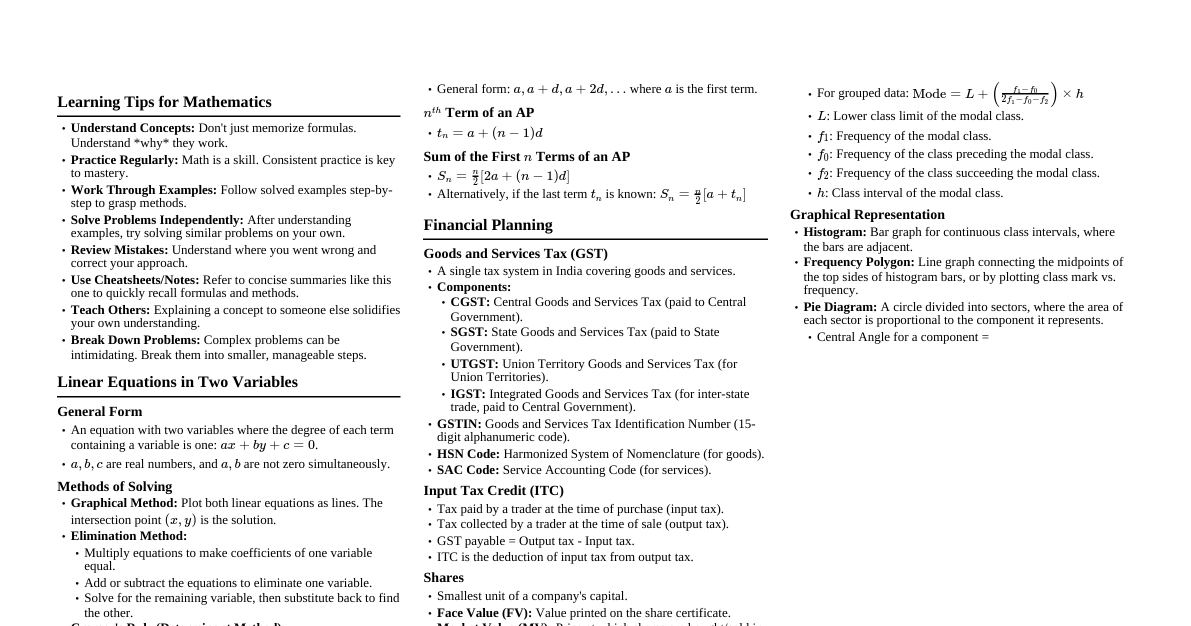
1. Linear Equations in Two Variables Key Formulas General Form: A linear equation in two variables is written as $ax + by + c = 0$. $a, b, c$ are real numbers. $a$ and $b$ are not zero simultaneously. Important Methods for Solving Simultaneous Linear Equations 1. Elimination Method: Eliminate one variable by making its coefficients equal in both equations. 2. Graphical Method: Plot both linear equations as straight lines. The point of intersection $(x, y)$ is the solution. If lines intersect at one point, unique solution. If lines are parallel, no solution. If lines are coincident, infinitely many solutions. 3. Determinant Method (Cramer's Rule): For equations $a_1x + b_1y = c_1$ and $a_2x + b_2y = c_2$: Determinant $D = \begin{vmatrix} a_1 & b_1 \\ a_2 & b_2 \end{vmatrix} = a_1b_2 - a_2b_1$ Determinant $D_x = \begin{vmatrix} c_1 & b_1 \\ c_2 & b_2 \end{vmatrix} = c_1b_2 - c_2b_1$ Determinant $D_y = \begin{vmatrix} a_1 & c_1 \\ a_2 & c_2 \end{vmatrix} = a_1c_2 - a_2c_1$ Solution: $x = \frac{D_x}{D}$, $y = \frac{D_y}{D}$ (provided $D \neq 0$) Equations Reducible to Linear Form: Introduce new variables to transform non-linear equations into linear ones. Example: For $\frac{1}{x} + \frac{1}{y} = k$, let $m = \frac{1}{x}$ and $n = \frac{1}{y}$ to get $m+n=k$. Example (Cramer's Rule): Solve: $5x + 3y = -11$ and $2x + 4y = -10$ $D = \begin{vmatrix} 5 & 3 \\ 2 & 4 \end{vmatrix} = (5 \times 4) - (3 \times 2) = 20 - 6 = 14$ $D_x = \begin{vmatrix} -11 & 3 \\ -10 & 4 \end{vmatrix} = (-11 \times 4) - (3 \times -10) = -44 - (-30) = -14$ $D_y = \begin{vmatrix} 5 & -11 \\ 2 & -10 \end{vmatrix} = (5 \times -10) - (-11 \times 2) = -50 - (-22) = -28$ $x = \frac{-14}{14} = -1$, $y = \frac{-28}{14} = -2$ 2. Quadratic Equations Key Formulas General Form: A quadratic equation is written as $ax^2 + bx + c = 0$. $a, b, c$ are real numbers. $a \neq 0$. Important Methods for Solving Quadratic Equations 1. Factorisation Method: Write the equation in standard form ($ax^2 + bx + c = 0$). Factorize the quadratic polynomial into two linear factors. Set each factor to zero to find the roots. 2. Completing the Square Method: Ensure the coefficient of $x^2$ is 1. If not, divide by $a$. Move the constant term to the right side: $x^2 + \frac{b}{a}x = -\frac{c}{a}$. Add $(\frac{b}{2a})^2$ to both sides to complete the square: $x^2 + \frac{b}{a}x + (\frac{b}{2a})^2 = -\frac{c}{a} + (\frac{b}{2a})^2$. Simplify to $(x + \frac{b}{2a})^2 = \frac{b^2 - 4ac}{4a^2}$. Take the square root of both sides and solve for $x$. 3. Quadratic Formula: The roots of $ax^2 + bx + c = 0$ are given by: $$ x = \frac{-b \pm \sqrt{b^2 - 4ac}}{2a} $$ The term $b^2 - 4ac$ is called the discriminant , denoted by $\Delta$ (Delta). Nature of Roots (based on Discriminant $\Delta$) Condition Nature of Roots $\Delta = 0$ Real and Equal $\Delta > 0$ Real and Unequal $\Delta Not Real Relation between Roots and Coefficients If $\alpha$ and $\beta$ are the roots of $ax^2 + bx + c = 0$: Sum of roots: $\alpha + \beta = -\frac{b}{a}$ Product of roots: $\alpha \beta = \frac{c}{a}$ Quadratic equation from roots: $x^2 - (\alpha + \beta)x + \alpha \beta = 0$ Example (Quadratic Formula): Solve: $2x^2 + 7x + 6 = 0$ Here $a=2, b=7, c=6$. $\Delta = b^2 - 4ac = 7^2 - 4(2)(6) = 49 - 48 = 1$ $x = \frac{-7 \pm \sqrt{1}}{2(2)} = \frac{-7 \pm 1}{4}$ $x_1 = \frac{-7+1}{4} = \frac{-6}{4} = -\frac{3}{2}$ $x_2 = \frac{-7-1}{4} = \frac{-8}{4} = -2$ 3. Arithmetic Progression Key Formulas Sequence: An ordered list of numbers. Arithmetic Progression (A.P.): A sequence where the difference between consecutive terms is constant. Common Difference ($d$): $d = t_{n+1} - t_n$ (constant). First Term: $a$ or $t_1$. $n^{th}$ term of an A.P.: $$ t_n = a + (n-1)d $$ Sum of the first $n$ terms of an A.P. ($S_n$): $$ S_n = \frac{n}{2} [2a + (n-1)d] $$ or $$ S_n = \frac{n}{2} [t_1 + t_n] $$ Example (A.P.): Find the 10th term and sum of the first 10 terms of the A.P. $2, 5, 8, \dots$ Here $a=2, d=5-2=3$. $t_{10} = a + (10-1)d = 2 + 9(3) = 2 + 27 = 29$ $S_{10} = \frac{10}{2} [2(2) + (10-1)3] = 5 [4 + 9(3)] = 5 [4 + 27] = 5 \times 31 = 155$ 4. Financial Planning Key Concepts GST (Goods and Services Tax): A consumption tax levied on goods and services. Components of GST: CGST (Central GST): Tax levied by the Central Government. SGST (State GST): Tax levied by the State Government. UTGST (Union Territory GST): For Union Territories. IGST (Integrated GST): For inter-state trade, collected by the Central Government. GST Rates: Vary (0%, 5%, 12%, 18%, 28%). CGST rate = SGST rate. Taxable Value: The value on which GST is calculated. Input Tax Credit (ITC): Tax paid on purchases can be used to reduce tax payable on sales. GST Payable = Output Tax - Input Tax Shares: Smallest unit of company's capital. Face Value (FV): Value printed on the share certificate. Market Value (MV): Price at which shares are traded. Dividend: Part of profit distributed to shareholders (calculated on FV). Premium: MV > FV; Par: MV = FV; Discount: MV Sum Invested: Number of shares $\times$ MV. Rate of Return (RoR): $\frac{\text{Dividend Income}}{\text{Sum Invested}} \times 100$. Brokerage: Commission paid to a share broker (calculated on MV). Total cost of buying: MV + Brokerage + GST on Brokerage. Amount received on selling: MV - Brokerage - GST on Brokerage. Mutual Funds: Professionally managed investment schemes. NAV (Net Asset Value): Market value of one unit of a mutual fund. Number of units = $\frac{\text{Sum Invested}}{\text{NAV}}$. SIP (Systematic Investment Plan): Regular investment of fixed amounts. Example (GST): Taxable value of a wrist watch belt is ₹586. Rate of GST is 18%. Find the price for the customer. GST = 18% of ₹586 = ₹105.48 Price for customer = Taxable Value + GST = ₹586 + ₹105.48 = ₹691.48 5. Probability Key Formulas Random Experiment: An experiment with known possible outcomes, but unpredictable individual results. Outcome: A possible result of a random experiment. Sample Space ($S$): The set of all possible outcomes of a random experiment. Number of Sample Points ($n(S)$): The total count of outcomes in the sample space. Event ($E$): A subset of the sample space (favourable outcomes). Number of Sample Points in Event ($n(E)$): The count of outcomes in an event. Probability of an Event ($P(E)$): $$ P(E) = \frac{\text{Number of sample points in event E}}{\text{Number of sample points in sample space}} = \frac{n(E)}{n(S)} $$ $0 \le P(E) \le 1$. $P(S) = 1$ (Probability of sure event). $P(\emptyset) = 0$ (Probability of impossible event). Example (Probability): A die is rolled. Find the probability of getting an even number. Sample Space $S = \{1, 2, 3, 4, 5, 6\}$, so $n(S) = 6$. Event $E$ (getting an even number) $= \{2, 4, 6\}$, so $n(E) = 3$. $P(E) = \frac{n(E)}{n(S)} = \frac{3}{6} = \frac{1}{2}$. 6. Statistics Key Concepts & Formulas Measures of Central Tendency: Mean, Median, Mode. 1. Mean ($\bar{X}$): Direct Method: $$ \bar{X} = \frac{\sum f_i x_i}{\sum f_i} $$ where $f_i$ is frequency and $x_i$ is class mark. Assumed Mean Method: $$ \bar{X} = A + \bar{d} = A + \frac{\sum f_i d_i}{\sum f_i} $$ where $A$ is assumed mean, $d_i = x_i - A$ is deviation. Step Deviation Method: $$ \bar{X} = A + \bar{u}g = A + \frac{\sum f_i u_i}{\sum f_i} g $$ where $g$ is class width (or common divisor of $d_i$), $u_i = \frac{d_i}{g}$. 2. Median ($M$): The middle value of an ordered dataset. For grouped data: $$ M = L + \left( \frac{\frac{N}{2} - cf}{f} \right) \times h $$ where $L$ is lower boundary of median class, $N = \sum f_i$, $cf$ is cumulative frequency of class preceding median class, $f$ is frequency of median class, $h$ is class width. 3. Mode ($Z$): The most frequent value. For grouped data: $$ Z = L + \left( \frac{f_1 - f_0}{2f_1 - f_0 - f_2} \right) \times h $$ where $L$ is lower boundary of modal class, $f_1$ is frequency of modal class, $f_0$ is frequency of preceding class, $f_2$ is frequency of succeeding class, $h$ is class width. Graphical Representation: Histogram: Bar graph for continuous class intervals. Frequency Polygon: Line graph connecting midpoints of the tops of histogram bars or plotting class mark vs. frequency. Pie Diagram: Circle divided into sectors proportional to the components of data. Central angle of a component = $\frac{\text{Number of scores in component}}{\text{Total number of scores}} \times 360^\circ$. Example (Mean - Direct Method): Class marks ($x_i$) and frequencies ($f_i$): $x_1=10, f_1=3; x_2=20, f_2=5$. $\sum f_i x_i = (10 \times 3) + (20 \times 5) = 30 + 100 = 130$ $\sum f_i = 3 + 5 = 8$ $\bar{X} = \frac{130}{8} = 16.25$