Mathematics Part-I Standard Ten
Cheatsheet Content
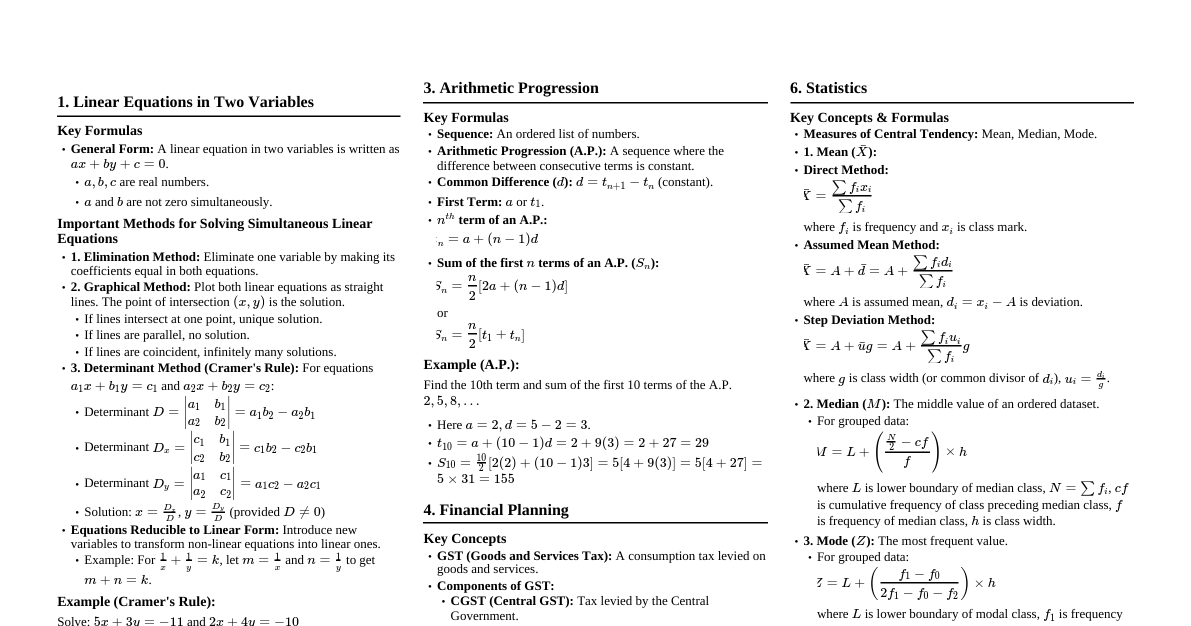
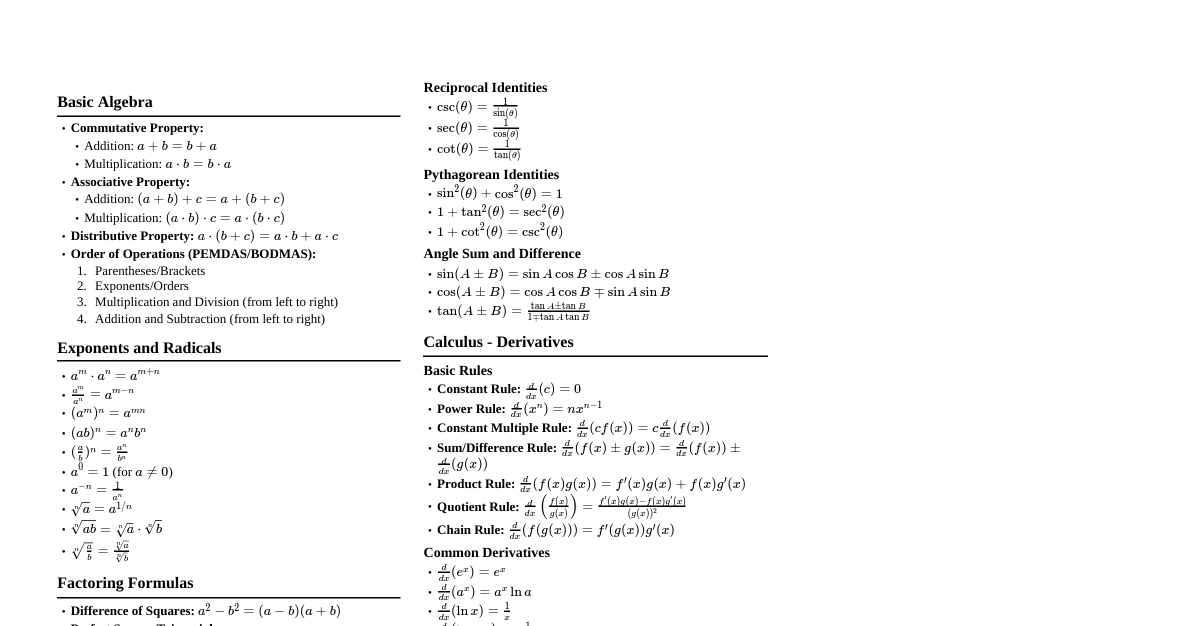
Learning Tips for Mathematics Understand Concepts: Don't just memorize formulas. Understand *why* they work. Practice Regularly: Math is a skill. Consistent practice is key to mastery. Work Through Examples: Follow solved examples step-by-step to grasp methods. Solve Problems Independently: After understanding examples, try solving similar problems on your own. Review Mistakes: Understand where you went wrong and correct your approach. Use Cheatsheets/Notes: Refer to concise summaries like this one to quickly recall formulas and methods. Teach Others: Explaining a concept to someone else solidifies your own understanding. Break Down Problems: Complex problems can be intimidating. Break them into smaller, manageable steps. Linear Equations in Two Variables General Form An equation with two variables where the degree of each term containing a variable is one: $ax + by + c = 0$. $a, b, c$ are real numbers, and $a, b$ are not zero simultaneously. Methods of Solving Graphical Method: Plot both linear equations as lines. The intersection point $(x, y)$ is the solution. Elimination Method: Multiply equations to make coefficients of one variable equal. Add or subtract the equations to eliminate one variable. Solve for the remaining variable, then substitute back to find the other. Cramer's Rule (Determinant Method): For equations $a_1x + b_1y = c_1$ and $a_2x + b_2y = c_2$: $D = \begin{vmatrix} a_1 & b_1 \\ a_2 & b_2 \end{vmatrix} = a_1b_2 - a_2b_1$ $D_x = \begin{vmatrix} c_1 & b_1 \\ c_2 & b_2 \end{vmatrix} = c_1b_2 - c_2b_1$ $D_y = \begin{vmatrix} a_1 & c_1 \\ a_2 & c_2 \end{vmatrix} = a_1c_2 - a_2c_1$ Solution: $x = \frac{D_x}{D}$, $y = \frac{D_y}{D}$ (provided $D \neq 0$). Equations Reducible to Linear Form Substitute new variables for expressions like $\frac{1}{x}$ or $\frac{1}{x+y}$ to convert non-linear equations into linear equations. Solve the new linear equations for the new variables. Substitute back to find the original variables. Quadratic Equations General Form An equation involving one variable with a maximum index of 2: $ax^2 + bx + c = 0$. $a, b, c$ are real numbers, and $a \neq 0$. Solutions (Roots) of a Quadratic Equation Values of the variable that satisfy the equation. Methods of Solving Factorization Method: Factorize the quadratic polynomial into two linear factors. Set each factor to zero and solve for $x$. Example: If $(x-p)(x-q)=0$, then $x=p$ or $x=q$. Completing the Square Method: Transform $ax^2 + bx + c = 0$ into the form $(x+k)^2 = m$ or $(x-k)^2 = m$. Take the square root of both sides and solve for $x$. Quadratic Formula: The roots of $ax^2 + bx + c = 0$ are given by $x = \frac{-b \pm \sqrt{b^2 - 4ac}}{2a}$. The term $b^2 - 4ac$ is called the discriminant, denoted by $\Delta$. Nature of Roots (based on Discriminant $\Delta = b^2 - 4ac$) If $\Delta = 0$: Roots are real and equal. If $\Delta > 0$: Roots are real and unequal. If $\Delta Relation between Roots and Coefficients For a quadratic equation $ax^2 + bx + c = 0$ with roots $\alpha$ and $\beta$: Sum of roots: $\alpha + \beta = -\frac{b}{a}$ Product of roots: $\alpha \beta = \frac{c}{a}$ Forming a Quadratic Equation from its Roots If $\alpha$ and $\beta$ are the roots, the quadratic equation is $x^2 - (\alpha + \beta)x + \alpha \beta = 0$. Arithmetic Progression (AP) Sequence A set of numbers arranged in a definite order. Arithmetic Progression A sequence where the difference between any two consecutive terms is constant. This constant difference is called the common difference ($d$). General form: $a, a+d, a+2d, \dots$ where $a$ is the first term. $n^{th}$ Term of an AP $t_n = a + (n-1)d$ Sum of the First $n$ Terms of an AP $S_n = \frac{n}{2}[2a + (n-1)d]$ Alternatively, if the last term $t_n$ is known: $S_n = \frac{n}{2}[a + t_n]$ Financial Planning Goods and Services Tax (GST) A single tax system in India covering goods and services. Components: CGST: Central Goods and Services Tax (paid to Central Government). SGST: State Goods and Services Tax (paid to State Government). UTGST: Union Territory Goods and Services Tax (for Union Territories). IGST: Integrated Goods and Services Tax (for inter-state trade, paid to Central Government). GSTIN: Goods and Services Tax Identification Number (15-digit alphanumeric code). HSN Code: Harmonized System of Nomenclature (for goods). SAC Code: Service Accounting Code (for services). Input Tax Credit (ITC) Tax paid by a trader at the time of purchase (input tax). Tax collected by a trader at the time of sale (output tax). GST payable = Output tax - Input tax. ITC is the deduction of input tax from output tax. Shares Smallest unit of a company's capital. Face Value (FV): Value printed on the share certificate. Market Value (MV): Price at which shares are bought/sold in the stock market (fluctuates). Dividend: Part of company's profit distributed to shareholders (calculated on FV). Sum Invested: Number of shares $\times$ MV. Rate of Return: $\frac{\text{Dividend Income}}{\text{Sum Invested}} \times 100$. Mutual Funds Professionally managed investment schemes where money from multiple investors is pooled to invest in securities. Units: Shares in a mutual fund. Net Asset Value (NAV): Market value of one unit. Systematic Investment Plan (SIP): Regular investment of small amounts over time. Probability Random Experiment An experiment where all possible outcomes are known in advance, but the exact outcome cannot be predicted with certainty. Each outcome has an equal possibility of occurring. Outcome A possible result of a random experiment. Equally Likely Outcomes: Outcomes that have an equal chance of occurring. Sample Space ($S$ or $\Omega$) The set of all possible outcomes of a random experiment. $n(S)$: Number of elements in the sample space. Event ($A, B, C, \dots$) A subset of the sample space, representing a specific condition or outcome. $n(A)$: Number of outcomes favorable to event $A$. Probability of an Event ($P(A)$) $P(A) = \frac{\text{Number of sample points in event A}}{\text{Number of sample points in sample space}} = \frac{n(A)}{n(S)}$ $0 \le P(A) \le 1$. If $P(A) = 0$, it's an impossible event. If $P(A) = 1$, it's a certain event. Statistics Measures of Central Tendency Mean ($\bar{X}$): Average of the data. Direct Method: $\bar{X} = \frac{\sum x_i f_i}{\sum f_i}$ (for grouped data, $x_i$ is class mark). Assumed Mean Method: $\bar{X} = A + \bar{d}$, where $\bar{d} = \frac{\sum f_i d_i}{\sum f_i}$ and $d_i = x_i - A$. Step Deviation Method: $\bar{X} = A + \bar{u} \cdot g$, where $\bar{u} = \frac{\sum f_i u_i}{\sum f_i}$, $u_i = \frac{d_i}{g}$, and $g$ is the GCD of $d_i$'s. Median: The middle value of a data set when arranged in ascending order. For grouped data: $\text{Median} = L + \left(\frac{\frac{N}{2} - cf}{f}\right) \times h$ $L$: Lower class limit of the median class. $N$: Sum of frequencies. $cf$: Cumulative frequency of the class preceding the median class. $f$: Frequency of the median class. $h$: Class interval of the median class. Mode: The value that appears most frequently in a data set. For grouped data: $\text{Mode} = L + \left(\frac{f_1 - f_0}{2f_1 - f_0 - f_2}\right) \times h$ $L$: Lower class limit of the modal class. $f_1$: Frequency of the modal class. $f_0$: Frequency of the class preceding the modal class. $f_2$: Frequency of the class succeeding the modal class. $h$: Class interval of the modal class. Graphical Representation Histogram: Bar graph for continuous class intervals, where the bars are adjacent. Frequency Polygon: Line graph connecting the midpoints of the top sides of histogram bars, or by plotting class mark vs. frequency. Pie Diagram: A circle divided into sectors, where the area of each sector is proportional to the component it represents. Central Angle for a component = $\frac{\text{Number of scores in component}}{\text{Total number of scores}} \times 360^\circ$