Biochemistry Cheatsheet
Cheatsheet Content
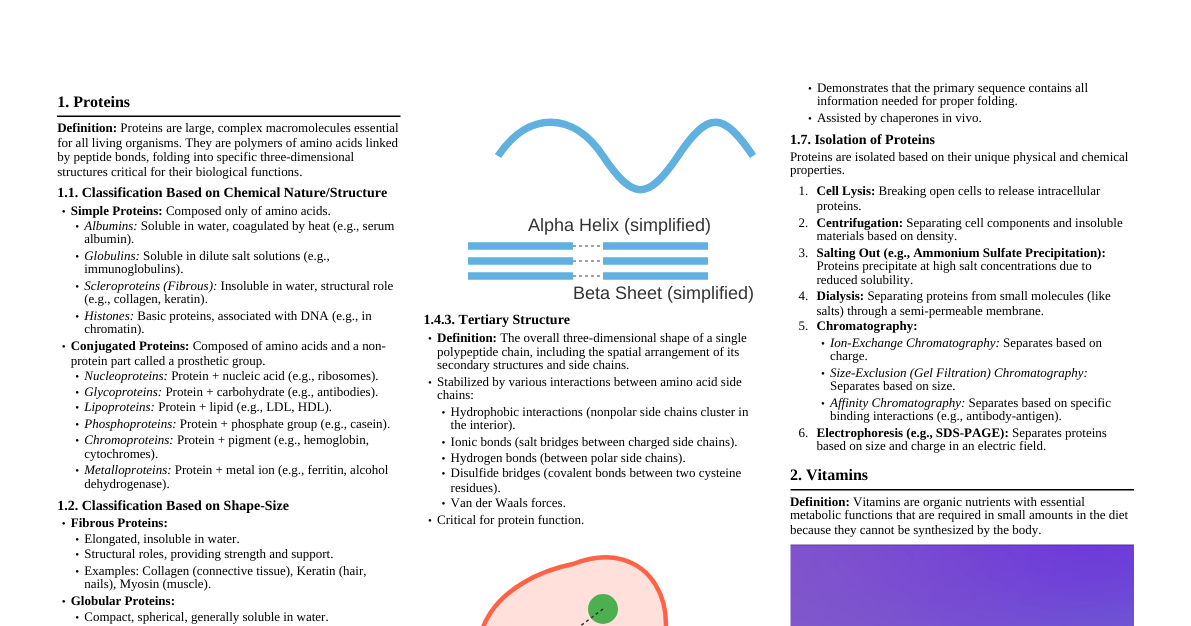
### ETC & Oxidative Phosphorylation - **Electron Transport Chain (ETC):** A series of protein complexes (I, II, III, IV) in the inner mitochondrial membrane that transfer electrons from NADH and FADH2 to O2. - **Complex I (NADH dehydrogenase):** Oxidizes NADH, transfers electrons to CoQ, pumps 4 H+. - **Complex II (Succinate dehydrogenase):** Oxidizes FADH2 (from TCA), transfers electrons to CoQ. No H+ pumped. - **Complex III (Cytochrome bc1 complex):** Transfers electrons from CoQH2 to cytochrome c, pumps 4 H+ (Q-cycle). - **Complex IV (Cytochrome c oxidase):** Transfers electrons from cytochrome c to O2 (final electron acceptor), forms H2O, pumps 2 H+. - **Proton Motive Force (PMF):** The gradient of protons (H+) across the inner mitochondrial membrane created by the ETC, storing potential energy. - **Oxidative Phosphorylation:** The process where ATP is synthesized from ADP and Pi, driven by the flow of protons back into the mitochondrial matrix through ATP synthase (Complex V). - **ATP Synthase (Complex V):** Uses the energy from PMF to rotate its F0 subunit, driving conformational changes in the F1 subunit to synthesize ATP. - **P/O Ratio:** Moles of ATP produced per mole of oxygen atoms reduced. - NADH ≈ 2.5 ATP - FADH2 ≈ 1.5 ATP #### Diagram: ETC & Oxidative Phosphorylation _Image Description: A diagram illustrating the inner mitochondrial membrane with Complexes I, II, III, IV, and ATP Synthase. Arrows indicate electron flow, proton (H+) pumping from the matrix to the intermembrane space, and proton flow back through ATP Synthase driving ATP synthesis._ ### Purine & Pyrimidine - **Definition:** Nitrogenous bases that are fundamental components of DNA and RNA. - **Purines:** Double-ring structures. - **Adenine (A)** - **Guanine (G)** - **Pyrimidines:** Single-ring structures. - **Cytosine (C)** - **Thymine (T)** (in DNA) - **Uracil (U)** (in RNA, replaces Thymine) - **Nucleosides:** Base + Pentose Sugar (e.g., Adenosine, Guanosine, Cytidine, Uridine, Deoxythymidine) - **Nucleotides:** Base + Pentose Sugar + Phosphate Group (e.g., ATP, GTP, CTP, UTP, dTMP) #### Diagram: Purine & Pyrimidine Structures _Image Description: Chemical structures showing the double-ring scaffold of purines (Adenine, Guanine) and the single-ring scaffold of pyrimidines (Cytosine, Thymine, Uracil)._ ### Protein Structure + Bonds - **Primary Structure:** Linear sequence of amino acids linked by **peptide bonds**. - **Peptide bond:** Amide linkage between the carboxyl group of one amino acid and the amino group of another. - **Secondary Structure:** Local folding patterns formed by **hydrogen bonds** between backbone atoms. - **Alpha-helix (α-helix):** Spiral shape, H-bonds between C=O of residue _n_ and N-H of residue _n+4_. - **Beta-pleated sheet (β-sheet):** Zigzag structure, H-bonds between backbone atoms of adjacent strands. Can be parallel or anti-parallel. - **Tertiary Structure:** Overall 3D shape of a single polypeptide chain, stabilized by various interactions between amino acid side chains (R-groups). - **Hydrophobic interactions:** Nonpolar groups cluster inward away from water. - **Ionic bonds (salt bridges):** Between oppositely charged R-groups. - **Hydrogen bonds:** Between polar R-groups. - **Disulfide bonds:** Covalent bond between two cysteine residues (-SH groups). - **Quaternary Structure:** Arrangement of multiple polypeptide chains (subunits) in a functional protein, held by same interactions as tertiary structure. #### Diagram: Protein Structural Levels _Image Description: Four panels showing the progression from primary (amino acid sequence with peptide bonds), secondary (alpha-helix and beta-sheet with hydrogen bonds), tertiary (overall 3D fold with various side chain interactions), to quaternary structure (multiple subunits assembling)._ ### Glycolysis - **Definition:** Metabolic pathway that breaks down a molecule of glucose (6-carbon) into two molecules of pyruvate (3-carbon), producing ATP and NADH. Occurs in the cytoplasm. - **Phases:** 1. **Energy Investment Phase (Steps 1-5):** Consumes 2 ATP to phosphorylate glucose, leading to fructose-1,6-bisphosphate and then cleavage into two 3-carbon molecules (glyceraldehyde-3-phosphate). 2. **Energy Payoff Phase (Steps 6-10):** Generates 4 ATP (net 2 ATP), 2 NADH, and 2 pyruvate molecules. - **Net Reaction:** Glucose + 2 ADP + 2 Pi + 2 NAD+ → 2 Pyruvate + 2 ATP + 2 NADH + 2 H+ + 2 H2O - **Key Regulatory Enzymes:** - **Hexokinase:** Inhibited by glucose-6-phosphate. - **Phosphofructokinase-1 (PFK-1):** Allosterically regulated, major control point. Activated by AMP, fructose-2,6-bisphosphate; inhibited by ATP, citrate. - **Pyruvate kinase:** Activated by fructose-1,6-bisphosphate; inhibited by ATP, acetyl-CoA. - **Fate of Pyruvate:** - **Aerobic:** Converted to Acetyl-CoA, enters TCA cycle. - **Anaerobic:** Fermentation (lactate in animals, ethanol in yeast). #### Diagram: Glycolysis Pathway _Image description: A detailed diagram showing the 10 enzymatic steps of glycolysis, starting from Glucose and ending with Pyruvate. Each step lists the substrate, product, enzyme, and the ATP/NADH consumed or produced._ ### TCA Cycle (Krebs Cycle / Citric Acid Cycle) - **Definition:** A central metabolic pathway occurring in the mitochondrial matrix that oxidizes acetyl-CoA to CO2, producing ATP (or GTP), NADH, and FADH2. - **Input:** Acetyl-CoA (from pyruvate oxidation, fatty acid beta-oxidation, or amino acid catabolism). - **Key Steps (8 steps):** 1. **Citrate Synthase:** Acetyl-CoA + Oxaloacetate → Citrate 2. **Aconitase:** Citrate → Isocitrate 3. **Isocitrate Dehydrogenase:** Isocitrate → α-Ketoglutarate + **NADH** + CO2 (a-KGDH complex) 4. **α-Ketoglutarate Dehydrogenase Complex:** α-Ketoglutarate → Succinyl-CoA + **NADH** + CO2 5. **Succinyl-CoA Synthetase:** Succinyl-CoA → Succinate + **GTP** (or ATP) 6. **Succinate Dehydrogenase (Complex II of ETC):** Succinate → Fumarate + **FADH2** 7. **Fumarase:** Fumarate → Malate 8. **Malate Dehydrogenase:** Malate → Oxaloacetate + **NADH** - **Per cycle (from one Acetyl-CoA):** - 3 NADH - 1 FADH2 - 1 GTP/ATP - 2 CO2 - **Regulation:** Primarily by availability of substrates (Acetyl-CoA, Oxaloacetate) and allosteric regulation of key enzymes (Citrate Synthase, Isocitrate Dehydrogenase, α-Ketoglutarate Dehydrogenase). High ATP/NADH typically inhibits. #### Diagram: TCA Cycle Pathway _Image description: A circular diagram representing the TCA cycle, starting with Acetyl-CoA combining with Oxaloacetate. Each step shows the enzyme, intermediate product, and the points of NADH, FADH2, and GTP/ATP production, concluding with the regeneration of Oxaloacetate._