Statistics Essentials
Cheatsheet Content
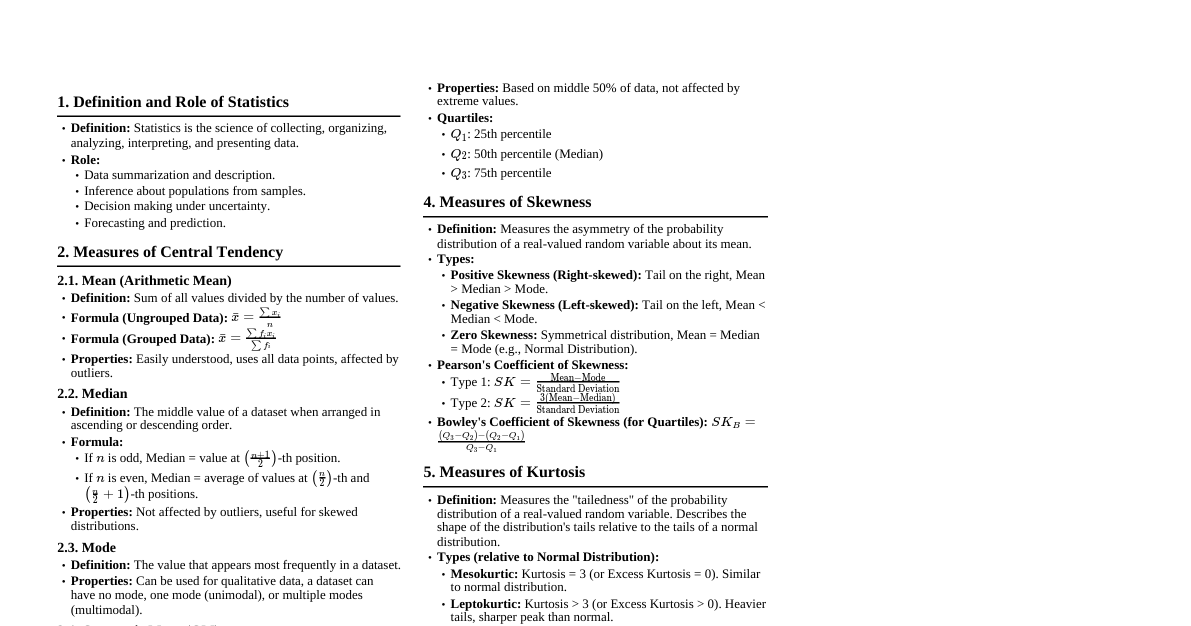
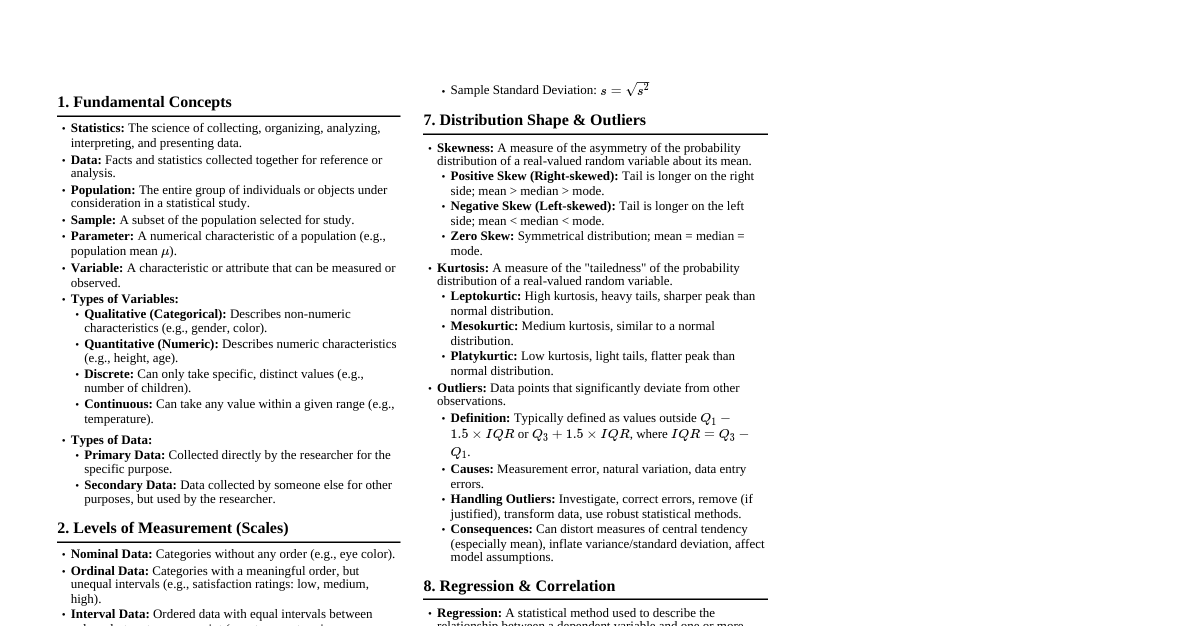
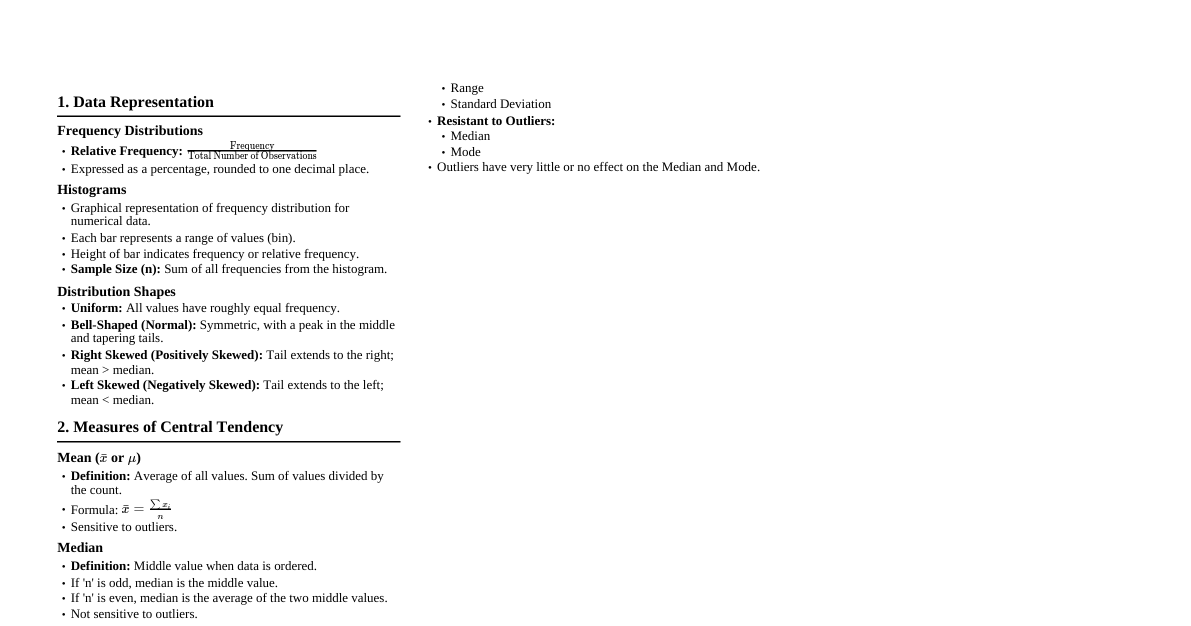
Glossary of Statistical Terms Frequency Distribution Table: A tabular presentation of data showing the frequency of each value or group of values. Range: The difference between the highest and lowest values in a dataset. Class: A grouping or category of data in a frequency distribution. Class Width (or Size): The size of each class, determined by dividing the range by the desired number of classes. Class Mark: The middle value of a class, calculated as (lower limit + upper limit) / 2. Class Boundaries: The true limits of a class, extending 0.5 below the lower limit and 0.5 above the upper limit to ensure continuity. Mean (Arithmetic Average): The sum of all values divided by the number of values. Median: The middle value in an ordered set of data. If there's an even number of values, it's the average of the two middle values. Mode: The value that appears most frequently in a dataset. A dataset can have one mode (unimodal), two modes (bimodal), or more (multimodal). Summation ($\Sigma$): The Greek letter sigma, representing the sum of a set of values. Assumed Mean (A.M.): A value chosen within the range of data to simplify calculations for the mean of grouped data. Deviation (d): The difference between a class mark and the assumed mean ($x - A.M.$). Statistical Variables and Frequency Distribution Statistical variables can be treated as ungrouped or grouped data. Tabular presentation is crucial for organizing data effectively. Constructing a Frequency Distribution Table Find the Range (R): $R = Highest\ Score - Lowest\ Score$. Determine the Number of Classes (k): Statisticians suggest $k$ between 5 and 15. Determine the Class Width (i): $i = \frac{Range}{Desired\ Number\ of\ Classes}$. Round up to the nearest integer for convenience. Establish Classes: Start with the lowest score as the lower limit of the first class. Add $(i-1)$ to the lower limit to get the upper limit of the first class. For subsequent classes, add $i$ to the lower and upper limits of the previous class. Ensure all scores are accommodated. Tally and Frequency (f): Count how many scores fall into each class. Class Mark (X): Calculate the midpoint of each class: $X = \frac{Lower\ Limit + Upper\ Limit}{2}$. Class Boundaries: For each class, subtract 0.5 from the lower limit and add 0.5 to the upper limit. Measures of Central Tendency These measures describe the center point of a dataset. 1. Mean (Arithmetic Average) The most commonly used measure of central tendency. For Ungrouped Data: $\bar{X} = \frac{\sum X}{n}$ Where $\sum X$ is the sum of all values and $n$ is the number of values. For Grouped Data (Direct Method): $\bar{X} = \frac{\sum (fX)}{\sum f}$ Where $f$ is the frequency of each class and $X$ is the class mark. For Grouped Data (Deviation Method): $\bar{X} = A.M. + \frac{\sum (fd)}{\sum f} \times i$ Where $A.M.$ is the assumed mean, $f$ is frequency, $d = \frac{X - A.M.}{i}$ (deviation from assumed mean scaled by class width), and $i$ is the class width. 2. Median The middle value when data is arranged in order. It divides the data into two equal halves. For Ungrouped Data: Arrange data in ascending or descending order. If $n$ is odd, the median is the $(\frac{n+1}{2})^{th}$ quantity. If $n$ is even, the median is the mean of the $(\frac{n}{2})^{th}$ and $(\frac{n}{2}+1)^{th}$ quantities. For Grouped Data: $Median = L_{mb} + \left(\frac{\frac{\sum f}{2} - cf_{ Where: $L_{mb}$ = lower boundary of the median class $\sum f$ = sum of frequencies (total number of values) $cf_{ $f_{me}$ = frequency of the median class $i$ = class width The median class is the first class for which the cumulative frequency is greater than or equal to $\frac{\sum f}{2}$. 3. Mode The value that occurs most frequently. For Ungrouped Data: Identify the value(s) with the highest frequency. A dataset can be unimodal, bimodal, or multimodal. If all values have the same frequency, there is no mode. For Grouped Data (Approximated Mode): $Mode = L_{mo} + \left(\frac{D_1}{D_1 + D_2}\right) i$ Where: $L_{mo}$ = lower boundary of the modal class (class with the highest frequency) $D_1$ = difference between the frequency of the modal class and the frequency of the class before it $D_2$ = difference between the frequency of the modal class and the frequency of the class after it $i$ = class width