Power BI Cheatsheet
Cheatsheet Content
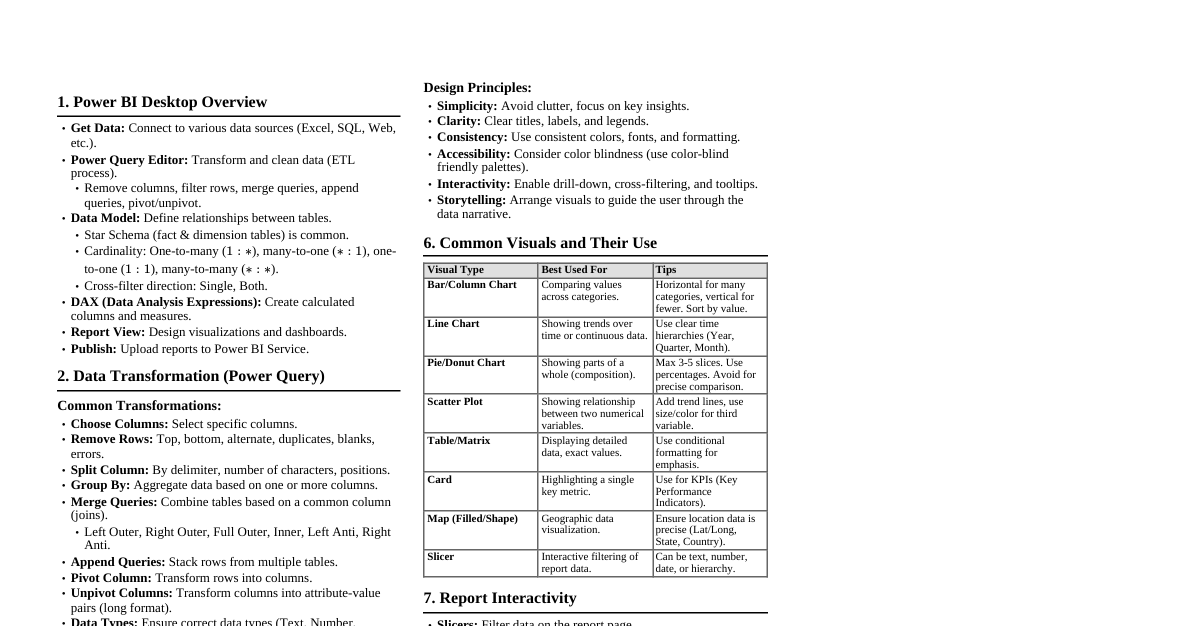
1. Power BI Desktop Interface Report View: Design reports, create visualizations. Data View: Inspect and transform data, manage relationships. Model View: View and manage relationships between tables. Fields Pane: Lists all tables and columns from your data model. Visualizations Pane: Select and customize chart types. Filters Pane: Apply filters at visual, page, or report level. 2. Data Import & Transformation (Power Query) Get Data: Connect to various data sources (Excel, SQL, Web, etc.). Power Query Editor: Steps Applied: Records all transformation steps. M Language: Underlying language for Power Query. Common Transformations: Remove Columns/Rows Keep Rows (Top/Bottom, Duplicates, Errors) Split Column (Delimiter, Number of Characters) Merge Queries (Join types: Left Outer, Inner, Full Outer, etc.) Append Queries (Stack tables) Group By (Aggregate data) Pivot/Unpivot Columns Add Custom Column (using M language) Change Data Type Close & Apply: Load transformed data into the Power BI data model. 3. Data Modeling & Relationships Relationships: Connect tables based on common columns. Cardinality: One-to-One (1:1), One-to-Many (1:N), Many-to-One (N:1), Many-to-Many (N:N). Cross Filter Direction: Single or Both. Active/Inactive: Only one active path between tables. Star Schema: Recommended model (Fact tables in center, Dimension tables around). Dimension Tables: Describe entities (e.g., Customers, Products, Dates). Fact Tables: Store transactional or event data (e.g., Sales, Orders). 4. DAX (Data Analysis Expressions) Basics Calculated Columns: Added to a table, row-context evaluation. Column = [Column1] * [Column2] Measures: Calculated on the fly, filter-context evaluation. Total Sales = SUM(Sales[SalesAmount]) Syntax: MeasureName = DAX_FUNCTION(Table[Column]) Context: Row Context: Evaluates expressions row by row (e.g., Calculated Columns). Filter Context: Filters applied to data (e.g., Slicers, Visuals). 5. Common DAX Functions Aggregation Functions SUM(Column) AVERAGE(Column) MIN(Column) MAX(Column) COUNT(Column) COUNTA(Column) (counts non-blank) COUNTROWS(Table) DISTINCTCOUNT(Column) Iterators (X-Functions) SUMX(Table, Expression) : Iterates over rows of a table and sums an expression. Total Revenue = SUMX(Sales, Sales[Quantity] * Sales[UnitPrice]) AVERAGEX(Table, Expression) MAXX(Table, Expression) MINX(Table, Expression) COUNTX(Table, Expression) Logical Functions IF(Logical_Test, Value_If_True, Value_If_False) AND(Logical1, Logical2) OR(Logical1, Logical2) NOT(Logical) SWITCH(Expression, Value1, Result1, ..., [Else]) Filter Functions CALCULATE(Expression, Filter1, Filter2, ...) : Changes filter context. Sales Last Year = CALCULATE([Total Sales], SAMEPERIODLASTYEAR('Date'[Date])) ALL(Table/Column) : Removes all filters from a table or column. Total Sales All Products = CALCULATE([Total Sales], ALL(Product)) ALLEXCEPT(Table, Column1, Column2) : Removes all filters from a table *except* for specified columns. FILTER(Table, Filter_Expression) : Returns a table filtered by the expression. High Value Customers = CALCULATE([Total Sales], FILTER(Customer, Customer[TotalPurchases] > 1000)) VALUES(Column) : Returns a one-column table of distinct values. RELATED(Column) : Retrieves a value from a related table (many-to-one side). RELATEDTABLE(Table) : Returns a table of all rows related to the current row. Time Intelligence Functions Requires a marked Date Table. TOTALYTD(Expression, Dates_Column, [Filter]) : Year-to-date. TOTALQTD(Expression, Dates_Column, [Filter]) : Quarter-to-date. TOTALMTD(Expression, Dates_Column, [Filter]) : Month-to-date. SAMEPERIODLASTYEAR(Dates_Column) DATEADD(Dates_Column, Number_Of_Intervals, Interval) (Interval: DAY, MONTH, QUARTER, YEAR) DATESBETWEEN(Dates_Column, StartDate, EndDate) PREVIOUSMONTH(Dates_Column) , PREVIOUSQUARTER(Dates_Column) , PREVIOUSYEAR(Dates_Column) 6. Visualizations Column/Bar Charts: Compare values across categories. Line Charts: Show trends over time. Area Charts: Show magnitude of change over time. Pie/Donut Charts: Show proportions of a whole (limited categories). Card: Display a single key metric. Table/Matrix: Detailed data view. Scatter Plot: Show relationship between two numerical variables. Map Visuals: Geographic data representation. Slicer: Interactive filter for reports. Gauge: Show progress towards a goal. KPI: Key Performance Indicator. 7. Report Design Best Practices Clarity & Simplicity: Avoid clutter, focus on key insights. Consistency: Use consistent colors, fonts, and layouts. Interactivity: Use slicers, drill-through, and tooltips. Accessibility: Consider color contrast, text size. Performance: Optimize data model, limit complex measures. 8. Power BI Service Publish: Upload reports from Desktop to Service. Workspaces: Organize reports, dashboards, and datasets. Dashboards: Curated collection of visuals from multiple reports. Gateways: Connect to on-premise data sources for refresh. Scheduling Refresh: Keep data up-to-date. Sharing & Collaboration: Share reports/dashboards with others. Apps: Distribute content to a broad audience.