Python for AI Cheatsheet
Cheatsheet Content
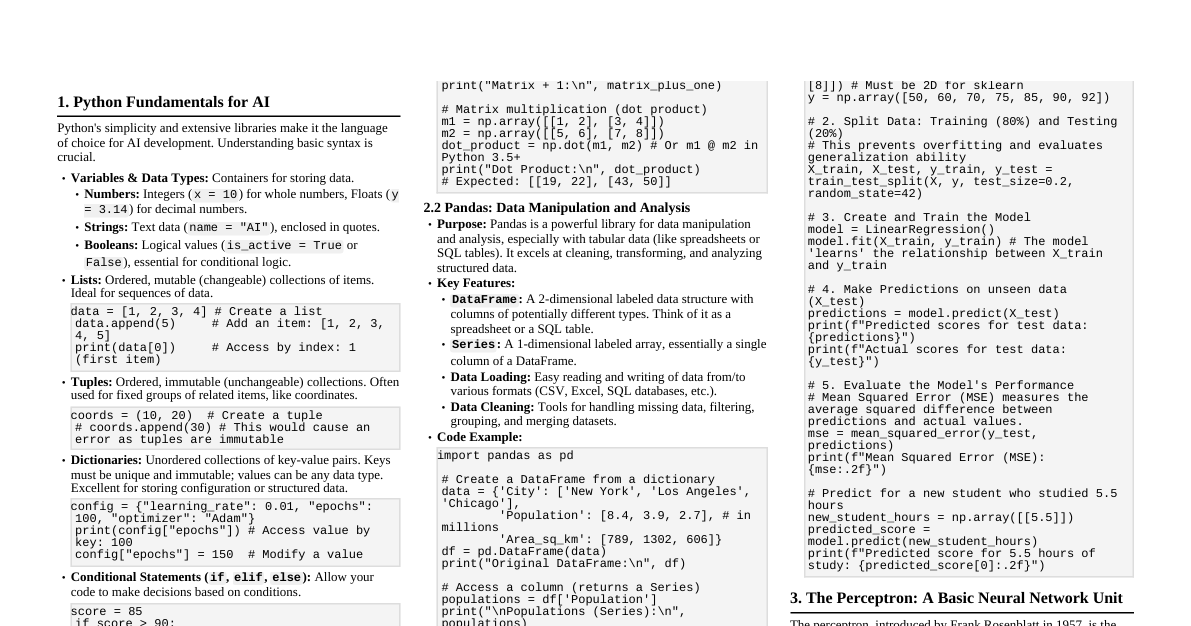
1. Python Basics for AI A quick refresher on fundamental Python concepts essential for AI/ML development. Variables & Types: Basic data containers. Numbers: Integers ($x = 10$), floating-point ($y = 3.14$). Strings: Text data, e.g., $s = \text{"hello"}$. Booleans: Logical values, $b = \text{True}$ or $b = \text{False}$. Lists: Ordered, mutable (changeable) collections of items. Can hold mixed data types. my_list = [1, "apple", 3.14] my_list.append(4) # Adds 4 to the end: [1, "apple", 3.14, 4] my_list[0] = 100 # Modifies first element: [100, "apple", 3.14, 4] Tuples: Ordered, immutable (unchangeable) collections. Once created, elements cannot be modified. Often used for fixed data such as coordinates. my_tuple = (1, "banana", 2.71) # my_tuple[0] = 100 # This would raise an error (tuples are immutable) Dictionaries: Unordered collections of key-value pairs. Keys must be unique and immutable (like strings or numbers). Efficient for lookup. my_dict = {'name': 'Alice', 'age': 30} print(my_dict['name']) # Output: Alice my_dict['age'] = 31 # Update value my_dict['city'] = 'NY' # Add new key-value pair Control Flow: Directs the execution of code. Conditionals ( if/elif/else ): Execute code based on conditions. score = 85 if score >= 90: print("Grade A") elif score >= 80: print("Grade B") else: print("Grade C") Loops ( for , while ): Repeat code blocks. # For loop: iterates over a sequence for item in [1, 2, 3]: print(item) # While loop: repeats as long as a condition is true i = 0 while i Functions: Reusable blocks of code that perform a specific task. They promote modularity and code reuse. def add_numbers(a, b): """This function returns the sum of two numbers.""" return a + b result = add_numbers(5, 3) # result will be 8 print(f"Sum: {result}") NumPy: The cornerstone library for numerical computing in Python, especially for AI. It provides high-performance multidimensional array objects ( ndarray ) and tools for working with them. Essential for efficient mathematical operations. import numpy as np # Create a 1D array (vector) arr = np.array([1, 2, 3]) # Create a 2D array (matrix) matrix = np.array([[1, 2], [3, 4]]) print(f"Array: {arr}, Shape: {arr.shape}") # Output: Array: [1 2 3], Shape: (3,) print(f"Matrix:\n{matrix}, Shape: {matrix.shape}") # Output: Matrix: [[1 2]\n [3 4]], Shape: (2, 2) # Perform element-wise operations print(f"Array * 2: {arr * 2}") # Output: Array * 2: [2 4 6] print(f"Matrix transpose:\n{matrix.T}") # Output: Matrix transpose: [[1 3]\n [2 4]] Pandas: A powerful library for data manipulation and analysis. It introduces DataFrames, which are tabular data structures similar to spreadsheets or SQL tables, providing rich functionalities for data cleaning, transformation, and exploration. import pandas as pd # Create a DataFrame from a dictionary data = {'column1': [10, 20, 30], 'column2': ['A', 'B', 'C']} df = pd.DataFrame(data) print("DataFrame:\n", df) # Output: # column1 column2 # 0 10 A # 1 20 B # 2 30 C print(f"Mean of column1: {df['column1'].mean()}") # Calculate mean of a column 2. ML/DL Model Creation Methodology Overview of the Machine Learning Workflow Building an effective ML/DL model typically follows a structured process, often iterative, encompassing data preparation, model training, and evaluation. This systematic approach helps ensure robust and reliable models. Problem Definition & Data Collection: Define Problem: Clearly state the objective (e.g., predict housing prices, classify spam emails, recognize objects in images). Identify Data: Determine what data is needed and its sources. Collect Data: Gather raw data. Ensure data is relevant, sufficient, and representative. Data Preprocessing: This crucial step transforms raw data into a clean and suitable format for machine learning algorithms. It's often the most time-consuming part of the workflow. Handling Missing Values: Fill (impute) with mean, median, mode, or a specific value, or remove rows/columns. Outlier Detection & Treatment: Identify and manage extreme values that can skew model training. Feature Scaling: Normalize or standardize numerical features to bring them to a similar scale. This is vital for many algorithms (e.g., KNN, SVMs, neural networks, gradient descent-based methods). Min-Max Scaling: Scales features to a fixed range, usually 0 to 1: $X_{scaled} = \frac{X - X_{min}}{X_{max} - X_{min}}$ Standardization (Z-score): Scales features to have a mean of 0 and a standard deviation of 1: $X_{scaled} = \frac{X - \mu}{\sigma}$ Encoding Categorical Data: Convert non-numerical (textual) categories into numerical representations that algorithms can process. One-Hot Encoding: Creates new binary features for each category (e.g., 'Red', 'Green', 'Blue' becomes [1,0,0], [0,1,0], [0,0,1]). Suitable for nominal categories. Label Encoding: Assigns a unique integer to each category (e.g., 'Red'=0, 'Green'=1, 'Blue'=2). Suitable for ordinal categories or when the number of categories is very large. Feature Engineering: Create new features or transform existing ones to improve model performance and capture more complex relationships. Data Splitting: Divide the preprocessed data to ensure unbiased model evaluation. Training Set: The largest portion (e.g., 70-80%) used to train the model. Validation Set (Optional but Recommended): A smaller portion (e.g., 10-15%) used to tune hyperparameters and evaluate model performance during training. It helps prevent overfitting to the training data. Test Set: A separate, unseen portion (e.g., 10-15%) used for a final, unbiased evaluation of the model's generalization performance. It should only be used once at the very end. Model Selection: Choose an appropriate algorithm based on the problem type (e.g., classification, regression, clustering), data characteristics (size, linearity), and computational resources. Model Training: Feed the training data to the selected algorithm. The algorithm learns patterns by optimizing an objective function (e.g., minimizing loss, maximizing likelihood) and adjusting its internal parameters (weights, biases). Hyperparameter Tuning: Optimize the model's external parameters (hyperparameters) that are not learned from data but set before training (e.g., learning rate, number of layers, `n_neighbors` in KNN, regularization strength). This is typically done using the validation set through techniques like Grid Search or Random Search. Model Evaluation: Assess the model's performance on the unseen test set using relevant metrics. Classification Metrics: Accuracy, Precision, Recall, F1-score, ROC-AUC. Regression Metrics: Mean Squared Error (MSE), Root Mean Squared Error (RMSE), Mean Absolute Error (MAE), R-squared ($R^2$). Deployment & Monitoring: Integrate the trained model into an application or system. Continuously monitor its performance in a real-world setting, as data distributions can change over time (concept drift), potentially degrading model accuracy. Feature Scaling Example (Standardization) Standardization (Z-score normalization) transforms data to have a mean of 0 and a standard deviation of 1. It's often crucial for algorithms sensitive to feature scales (e.g., KNN, SVMs, neural networks, gradient descent-based optimizers). from sklearn.preprocessing import StandardScaler import numpy as np # Sample data with different scales data = np.array([[10, 2], [20, 4], [30, 6], [40, 8], [50, 10]]) print("Original Data:\n", data) # Create a StandardScaler instance scaler = StandardScaler() # Fit the scaler to the data and then transform it scaled_data = scaler.fit_transform(data) print("Scaled Data (Mean=0, Std=1):\n", scaled_data.round(2)) # Verify mean and standard deviation for scaled data print(f"Mean of scaled data (col 0): {scaled_data[:, 0].mean():.2f}") print(f"Std of scaled data (col 0): {scaled_data[:, 0].std():.2f}") 3. Machine Learning - Perceptron Concept The Perceptron is the simplest form of an artificial neural network, serving as a linear binary classifier. Developed by Frank Rosenblatt in 1957, it's inspired by the biological neuron. A perceptron takes multiple numerical inputs, each multiplied by a corresponding weight. These weighted inputs are summed, along with a bias term, to produce a net input. This net input is then passed through an activation function (typically a step function) to produce a binary output (e.g., 0 or 1, or -1 or 1). It learns by iteratively adjusting its weights and bias based on misclassified examples. The Perceptron learning algorithm is guaranteed to converge if the data is linearly separable, meaning a single straight line (or hyperplane) can perfectly separate the classes. Output Calculation: The perceptron's output $y$ is determined by: $y = f(\text{net\_input})$ where $\text{net\_input} = \sum_{i=1}^n w_i x_i + b$ and $f(z)$ is a step activation function, for example: $f(z) = \begin{cases} 1 & \text{if } z \ge 0 \\ 0 & \text{if } z $x_i$: Input features $w_i$: Weights corresponding to each input feature $b$: Bias term $f$: Activation function $x_1$ $x_2$ $x_3$ $x_n$ $w_1$ $w_2$ $w_3$ $\Sigma$ $+b$ Act. Output Implementation (Python from scratch) import numpy as np class Perceptron: def __init__(self, learning_rate=0.01, n_iterations=100): # Initialize hyperparameters self.lr = learning_rate # Learning rate: controls the step size during weight updates. A smaller LR means slower, more stable learning. self.n_iters = n_iterations # Number of epochs (iterations over the entire dataset). More iterations allow more learning. self.activation_func = self._unit_step_func # The activation function used to produce the output. self.weights = None # Weights, initialized later based on the number of features. self.bias = None # Bias, a single value, also initialized later. # The training method for the perceptron def fit(self, X, y): n_samples, n_features = X.shape # Get number of samples (rows) and features (columns) from input data. # Initialize weights to zeros (one weight for each feature) self.weights = np.zeros(n_features) # Initialize bias to zero self.bias = 0 # Ensure labels are 0 or 1 for this specific step function. # np.where converts actual labels: any value > 0 becomes 1, otherwise 0. y_ = np.where(y > 0, 1, 0) # Training loop: Iterate for a specified number of epochs for _ in range(self.n_iters): # Iterate through each individual sample in the training data for idx, x_i in enumerate(X): # Calculate the net input (weighted sum of inputs + bias) # np.dot(x_i, self.weights) performs the sum(w_i * x_i) linear_output = np.dot(x_i, self.weights) + self.bias # Apply the activation function to get the perceptron's predicted output (0 or 1) y_predicted = self.activation_func(linear_output) # Perceptron learning rule: Adjust weights and bias if there's a misclassification. # The 'update' term is (actual_label - predicted_label). # If prediction is correct, update is 0, so no change. # If actual=1, predicted=0, update=1. Weights increase towards input. # If actual=0, predicted=1, update=-1. Weights decrease away from input. update = self.lr * (y_[idx] - y_predicted) # Update weights: weights = weights + learning_rate * (error) * input self.weights += update * x_i # Update bias: bias = bias + learning_rate * (error) self.bias += update # The prediction method for new data def predict(self, X): # Calculate the net input for the given input data linear_output = np.dot(X, self.weights) + self.bias # Apply the activation function to get the binary predictions y_predicted = self.activation_func(linear_output) return y_predicted # The unit step activation function (threshold function) def _unit_step_func(self, x): # Returns 1 if the input x is greater than or equal to 0, otherwise returns 0. return np.where(x >= 0, 1, 0) # --- Example Usage (AND gate) --- print("--- Perceptron for AND gate ---") # Input features for the AND gate logic X = np.array([[0, 0], [0, 1], [1, 0], [1, 1]]) # Corresponding target labels for the AND gate y = np.array([0, 0, 0, 1]) # Create a Perceptron instance with learning rate 0.1 and 10 iterations p = Perceptron(learning_rate=0.1, n_iterations=10) # Train the perceptron on the AND gate data p.fit(X, y) print(f"Learned Perceptron Weights: {p.weights}") print(f"Learned Perceptron Bias: {p.bias}") # Test the trained perceptron with the same inputs to see its performance test_inputs = np.array([[0, 0], [0, 1], [1, 0], [1, 1]]) predictions = p.predict(test_inputs) print("\nPredictions for AND gate:") for i, pred in enumerate(predictions): print(f"Input: {test_inputs[i]}, Actual: {y[i]}, Predicted: {int(pred)}") # The perceptron successfully learns the AND gate because it is linearly separable. # For non-linearly separable problems (e.g., XOR gate), a single perceptron cannot find a solution. 4. Machine Learning - Linear Regression Concept Linear Regression is a fundamental statistical and machine learning method used for modeling the linear relationship between a dependent variable (the 'target' or 'output', $y$) and one or more independent variables (the 'features' or 'inputs', $x$). The goal is to find the best-fitting straight line (or hyperplane in multiple dimensions) that minimizes the sum of squared differences between the predicted values and the actual observed values. This sum of squared differences is commonly known as the Mean Squared Error (MSE), which serves as the loss function for this model. Equation of a line: For a single feature, the relationship is expressed as: $y = \beta_0 + \beta_1 x + \epsilon$ General Equation (Multiple Linear Regression): For multiple features, the equation extends to: $y = \beta_0 + \beta_1 x_1 + \beta_2 x_2 + \dots + \beta_n x_n + \epsilon$ $y$: The dependent variable (target) we want to predict. $x_i$: The $i$-th independent variable (feature). $\beta_0$: The y-intercept, representing the value of $y$ when all $x_i$ are zero. $\beta_i$: The coefficient (slope) for the $i$-th feature, indicating how much $y$ changes for a one-unit increase in $x_i$, holding other features constant. $\epsilon$: The error term (residuals), representing the irreducible error or noise not explained by the model. Features (X) Target (y) Best Fit Line Implementation (Scikit-learn) Scikit-learn is a widely used Python library offering efficient tools for various machine learning tasks, including linear regression. It provides a consistent API for model training and evaluation. from sklearn.linear_model import LinearRegression from sklearn.model_selection import train_test_split from sklearn.metrics import mean_squared_error, r2_score import numpy as np print("--- Linear Regression Example ---") # 1. Sample Data: We create some synthetic data where y approximately depends linearly on X. # X represents a feature (e.g., hours studied), y represents the target (e.g., exam score). # X must be a 2D array (n_samples, n_features) for scikit-learn. X = np.array([1, 2, 3, 4, 5, 6, 7, 8, 9, 10]).reshape(-1, 1) # Reshape to (10, 1) y = np.array([2, 4, 5, 4, 5, 7, 8, 9, 10, 11]) # Target variable # 2. Data Splitting: Split the dataset into training and testing sets. # X_train, y_train: Used to train the model. # X_test, y_test: Used to evaluate the model's performance on unseen data. # test_size=0.3 means 30% of the data will be allocated to the test set. # random_state ensures reproducibility of the split across multiple runs. X_train, X_test, y_train, y_test = train_test_split(X, y, test_size=0.3, random_state=42) print(f"Training data shape: {X_train.shape}, {y_train.shape}") print(f"Testing data shape: {X_test.shape}, {y_test.shape}") # 3. Model Creation and Training: # Instantiate the LinearRegression model. model = LinearRegression() # Train the model using the training data. The 'fit' method calculates the optimal # coefficients (beta_i) and intercept (beta_0) that minimize the MSE on the training data. model.fit(X_train, y_train) print("\nLinear Regression model training complete.") # 4. Make Predictions: # Use the trained model's 'predict' method to generate predictions on the test set. # This simulates how the model would perform on new, unseen data. y_pred = model.predict(X_test) print(f"Test Actual values: {y_test}") print(f"Test Predicted values: {y_pred.round(2)}") # Round predictions for cleaner output # 5. Model Evaluation: Assess the model's performance using regression metrics. # Mean Squared Error (MSE): Measures the average of the squared errors. Lower is better. mse = mean_squared_error(y_test, y_pred) # R-squared (R2 Score): Represents the proportion of the variance in the dependent variable # that is predictable from the independent variables. Ranges from 0 to 1, where 1 indicates a perfect fit. r2 = r2_score(y_test, y_pred) print(f"\nModel Coefficients (slope): {model.coef_[0]:.2f}") # The slope (beta_1) print(f"Model Intercept: {model.intercept_:.2f}") # The y-intercept (beta_0) print(f"Mean Squared Error (MSE) on test set: {mse:.2f}") print(f"R-squared (R2 Score) on test set: {r2:.2f}") # Example of making a new prediction: new_X = np.array([[7.5]]) # Predict score for 7.5 hours studied. Input must be 2D. new_prediction = model.predict(new_X) print(f"\nPrediction for 7.5 hours studied: {new_prediction[0]:.2f}") 5. Machine Learning - K-Nearest Neighbors (KNN) Concept K-Nearest Neighbors (KNN) is a simple, non-parametric, and lazy learning algorithm primarily used for classification and regression tasks. "Non-parametric" means it makes no assumptions about the underlying data distribution. "Lazy" means it performs minimal or no learning during the training phase; instead, it memorizes the entire training dataset. The "computation" happens during the prediction phase. When a new data point needs to be classified or predicted, KNN identifies the 'k' nearest data points (neighbors) from the training set based on a chosen distance metric. For Classification: The new point is assigned the class label most common among its 'k' neighbors (a majority vote). For Regression: The new point's value is the average (or weighted average) of the values of its 'k' neighbors. Key Idea: "Birds of a feather flock together" – data points that are close to each other in the feature space are likely to share similar characteristics or belong to the same class. Distance Metric: How "near" points are measured. The choice of distance metric is crucial. Euclidean distance: Most common for continuous features, calculated as the straight-line distance between two points. For two points $p=(p_1, \dots, p_n)$ and $q=(q_1, \dots, q_n)$ in n-dimensional space: $d(p,q) = \sqrt{\sum_{i=1}^n (q_i - p_i)^2}$ Manhattan distance: (or City Block distance) Sum of the absolute differences of their Cartesian coordinates. Other metrics include Minkowski, Chebyshev, etc. New Point Class A (Blue) Class B (Red) k=3 circle Implementation (Scikit-learn) from sklearn.neighbors import KNeighborsClassifier from sklearn.model_selection import train_test_split from sklearn.metrics import accuracy_score from sklearn.preprocessing import StandardScaler # Essential for distance-based algorithms import numpy as np print("--- K-Nearest Neighbors Example ---") # 1. Sample Data: # X represents features (e.g., sepal length, sepal width from Iris dataset simplified). # y represents the class label (e.g., 0 for one type of flower, 1 for another). X = np.array([[1,1],[1,2],[2,2],[2,3], # Group 1 (Class 0) [7,8],[8,8],[8,9],[9,9]]) # Group 2 (Class 1) y = np.array([0,0,0,0,1,1,1,1]) # Corresponding class labels # 2. Data Splitting: Divide the dataset into training and testing sets. X_train, X_test, y_train, y_test = train_test_split(X, y, test_size=0.3, random_state=42) print(f"Training data shape: {X_train.shape}, {y_train.shape}") print(f"Testing data shape: {X_test.shape}, {y_test.shape}") # 3. Feature Scaling (Crucial for KNN): # KNN relies on distance calculations. If features have different scales (e.g., one feature in meters, another in millimeters), # features with larger numerical ranges will disproportionately influence the distance calculation. # Standardization (using StandardScaler) transforms data to have a mean of 0 and std dev of 1, ensuring all features contribute equally. scaler = StandardScaler() # Fit the scaler ONLY on the training data to learn its mean and standard deviation. X_train_scaled = scaler.fit_transform(X_train) # Transform the test data using the *same* scaler fitted on the training data. # This prevents data leakage from the test set into the training process. X_test_scaled = scaler.transform(X_test) print(f"\nOriginal X_train:\n{X_train}") print(f"Scaled X_train (mean=0, std=1):\n{X_train_scaled.round(2)}") # 4. Model Creation and Training: # Instantiate KNeighborsClassifier. The most important parameter is 'n_neighbors' (k). # We choose k=3, meaning it will consider the 3 closest data points for classification. knn = KNeighborsClassifier(n_neighbors=3) # Train the model using the *scaled training data*. For KNN, "training" simply means storing # these scaled training data points and their corresponding labels for later reference. knn.fit(X_train_scaled, y_train) print("\nKNN model trained (training data memorized).") # 5. Make Predictions: # Use the trained model to predict the class labels for the *scaled test set*. y_pred = knn.predict(X_test_scaled) print(f"\nTest Actual Labels (y_test): {y_test}") print(f"Test Predicted Labels (y_pred): {y_pred}") # 6. Model Evaluation: # Accuracy Score: The proportion of correctly classified instances on the test set. # This metric gives a general idea of how often the classifier is correct. accuracy = accuracy_score(y_test, y_pred) print(f"Model Accuracy on test set: {accuracy*100:.2f}%") # Example of a new prediction: new_point = np.array([[5, 6]]) # A new data point (unseen by the model) # IMPORTANT: Any new data point must also be scaled using the *same scaler* # that was fitted on the training data. new_point_scaled = scaler.transform(new_point) prediction_for_new_point = knn.predict(new_point_scaled) print(f"\nPrediction for new point {new_point[0]} (scaled: {new_point_scaled[0].round(2)}): Class {prediction_for_new_point[0]}") 6. Deep Learning - Simple Neural Network (ANN) Concept An Artificial Neural Network (ANN), often specifically referred to as a Multi-Layer Perceptron (MLP) when it has multiple layers, is a computational model inspired by the biological neural networks in the brain. ANNs are capable of learning complex, non-linear patterns in data, making them suitable for tasks like image recognition, natural language processing, and complex regression problems. An ANN consists of multiple layers of interconnected nodes, or "neurons." Each connection between neurons has an associated weight, and each neuron has a bias term and an activation function. The network learns by iteratively adjusting these weights and biases through an optimization process (e.g., gradient descent and backpropagation) to minimize a predefined loss function. Input Layer: The first layer, which receives the raw input data (features). The number of neurons in this layer typically equals the number of features in the dataset. Hidden Layers: One or more intermediate layers between the input and output. These layers perform computations and extract increasingly complex features from the input data. The "depth" of a neural network refers to the number of hidden layers. Output Layer: The final layer, which produces the network's prediction. The number of neurons and the activation function depend on the task: Binary Classification: 1 neuron, Sigmoid activation (output probability between 0 and 1). Multi-class Classification: N neurons (where N is the number of classes), Softmax activation (output probability distribution over N classes). Regression: 1 neuron (or more for multi-output regression), linear activation (output continuous value). Weights ($w$): Numerical parameters that quantify the strength of the connection between neurons. These are the primary learnable parameters of the network. Bias ($b$): An additional learnable parameter for each neuron that allows the activation function to be shifted, providing more flexibility to the model. Activation Function ($f$): Introduces non-linearity into the network. Without non-linear activation functions, an ANN, regardless of its depth, would only be able to model linear relationships. ReLU (Rectified Linear Unit): $f(x) = \max(0, x)$. Popular in hidden layers for its computational efficiency and ability to mitigate vanishing gradient problems. Sigmoid: $f(x) = \frac{1}{1 + e^{-x}}$. Squashes output between 0 and 1. Used in binary classification output layers. Softmax: Used in output layers for multi-class classification, converting raw outputs (logits) into a probability distribution where all probabilities sum to 1. Tanh (Hyperbolic Tangent): $f(x) = \frac{e^x - e^{-x}}{e^x + e^{-x}}$. Squashes output between -1 and 1. Loss Function: A mathematical function that quantifies the difference between the model's predictions and the actual target values. The goal of training is to minimize this loss. Examples: `binary_crossentropy`, `categorical_crossentropy` (for classification), `mean_squared_error` (for regression). Optimizer: An algorithm (e.g., `Adam`, `SGD`, `RMSprop`) that adjusts the model's weights and biases during training to minimize the loss function. It determines how the network learns from errors. $x_1$ $x_2$ $x_3$ Input Hidden Output Weights & Biases Weights & Biases Act. Func. Act. Func. Implementation (TensorFlow/Keras) TensorFlow is an open-source machine learning framework developed by Google. Keras is a high-level API for building and training deep learning models, which runs on top of TensorFlow, making it easier and faster to define and experiment with neural network architectures. import tensorflow as tf from tensorflow import keras from sklearn.model_selection import train_test_split import numpy as np print("--- Simple Neural Network (ANN) Example ---") # 1. Sample Data: We'll use the XOR problem, which is not linearly separable. # This problem is a classic example that demonstrates the need for a hidden layer in ANNs. # X_features: Two binary inputs (0 or 1) # y_labels: The XOR output (0 if inputs are the same, 1 if inputs are different) X = np.array([[0,0],[0,1],[1,0],[1,1]], dtype=np.float32) y = np.array([0,1,1,0], dtype=np.float32) # For such a small dataset, splitting into train/test might not show real generalization benefits, # but in real-world scenarios, always split your data. Here, we train and evaluate on the same data # for simplicity to demonstrate the model learning the XOR function. # 2. Build the Model (Keras Sequential API): # The Sequential API allows building models layer-by-layer, which is suitable for simple stack architectures. model = keras.Sequential([ # Input Layer: The input shape is defined in the first Dense layer. # Hidden Layer: A `Dense` layer (fully connected) with 4 neurons. # `input_shape=(2,)` specifies that each input sample has 2 features. # `activation='relu'` applies the Rectified Linear Unit activation function. ReLU is common in hidden layers. keras.layers.Dense(4, input_shape=(2,), activation='relu', name='hidden_layer'), # Output Layer: Another `Dense` layer with 1 neuron for binary classification. # `activation='sigmoid'` squashes the output between 0 and 1, which can be interpreted as a probability. # This is suitable for binary classification tasks. keras.layers.Dense(1, activation='sigmoid', name='output_layer') ]) # 3. Compile the Model: # This step configures the model for the training process by specifying essential components. model.compile( optimizer='adam', # `Adam` is an efficient and widely used optimization algorithm (a variant of gradient descent). # It adapts the learning rate for each parameter during training. loss='binary_crossentropy', # This is the appropriate loss function for binary classification problems, # measuring the difference between predicted probabilities and actual binary labels. metrics=['accuracy'] # We want to track the classification accuracy during training to monitor performance. ) # Print a summary of the model architecture, including the type of each layer, # its output shape, and the number of trainable parameters (weights and biases). model.summary() # 4. Train the Model: # The `fit` method starts the training process. # `X`, `y`: The input features and corresponding target labels for training. # `epochs=1000`: The model will iterate over the entire dataset 1000 times. Each epoch involves forward and backward passes. # `verbose=0`: Suppresses detailed training output for brevity. Use `verbose=1` or `2` to see progress bars and logs. print("\nTraining the model (this may take a moment)...") model.fit(X, y, epochs=1000, verbose=0) print("Model training complete.") # 5. Evaluate the Model: # The `evaluate` method computes the loss and metrics on the given data. # Here, we evaluate on the same data used for training to see how well it learned the XOR function. loss, accuracy = model.evaluate(X, y, verbose=0) print(f"\nModel Loss on training data: {loss:.4f}") print(f"Model Accuracy on training data: {accuracy*100:.2f}%") # 6. Make Predictions: # The `predict` method generates output predictions (probabilities in this case) for the input samples. predictions = model.predict(X) # For binary classification, we convert the output probabilities (0-1) into hard binary classes (0 or 1) # by applying a threshold (e.g., > 0.5). binary_predictions = (predictions > 0.5).astype(int) print("\nPredictions for XOR gate:") for i in range(len(X)): print(f"Input: {X[i]}, Actual: {int(y[i])}, Predicted (prob): {predictions[i][0]:.4f}, Predicted (binary): {binary_predictions[i][0]}") # A properly trained ANN should achieve high accuracy on the XOR problem, demonstrating its ability to learn non-linear decision boundaries. 7. Deep Learning - Convolutional Neural Networks (CNN) Concept Convolutional Neural Networks (CNNs) are a specialized type of deep neural network that are highly effective for processing grid-like data, such as images, videos, and time series. Their architecture is specifically designed to automatically and adaptively learn spatial hierarchies of features from input data, making them a cornerstone of modern computer vision. The success of CNNs stems from their ability to identify patterns (like edges, textures, and shapes) at various levels of abstraction and locations within the input, thanks to their unique layer types: Convolutional Layer: This is the fundamental building block of a CNN. Filters (Kernels): A set of small, learnable matrices that slide across the input image. Each filter is designed to detect a specific feature (e.g., a vertical edge, a particular texture). Convolution Operation: The filter performs element-wise multiplication with the portion of the image it's currently over, sums the results, and produces a single value in an output feature map. This process is repeated across the entire input, creating a feature map that highlights where the detected feature is present in the image. Local Receptive Fields: Neurons in a convolutional layer are only connected to a small, local region of the input, allowing them to focus on local patterns. Weight Sharing: The same filter is applied across the entire input, meaning the same set of weights (the filter's values) is used for all locations. This drastically reduces the number of parameters and makes the network robust to translations of features within the image. Activation Layer (e.g., ReLU): Applied immediately after each convolutional layer. It introduces non-linearity, which is critical for the network to learn complex patterns that go beyond simple linear combinations of features. ReLU ($f(x) = \max(0, x)$) is common due to its computational efficiency and ability to mitigate vanishing gradients. Pooling Layer (e.g., Max Pooling): This layer's primary role is to reduce the spatial dimensions (width and height) of the feature maps, thereby reducing the number of parameters and computational load. It also helps in making the model more robust to small shifts or distortions in the input image. Max Pooling: The most common type. It takes the maximum value from a small, non-overlapping window (e.g., a 2x2 region) within the feature map. Other types include Average Pooling. Flatten Layer: After several convolutional and pooling layers, the output feature maps are typically 2D or 3D. The `Flatten` layer converts these multi-dimensional feature maps into a single, long 1D vector. This transformation is necessary to feed the data into subsequent fully connected (Dense) layers. Fully Connected (Dense) Layers: These are standard neural network layers, similar to those in an ANN/MLP. They take the high-level features extracted by the convolutional layers (now flattened into a vector) and perform the final classification or regression based on these features. Output Layer: The very last fully connected layer. Its configuration depends on the task: For multi-class classification (like image classification into categories), it typically has a number of neurons equal to the number of classes and uses a `Softmax` activation function to output class probabilities. Input Image Filter Feature Map 1 Feature Map 2 Pooled Pooled Output (Classes) Conv. Layer ReLU Pool. Layer FC Layer Implementation (TensorFlow/Keras) This implementation demonstrates a simple CNN for image classification using the MNIST dataset, which consists of grayscale images of handwritten digits (0-9). import tensorflow as tf from tensorflow import keras from tensorflow.keras import layers import numpy as np print("--- Convolutional Neural Network (CNN) Example ---") # 1. Load and Preprocess Data: # The MNIST dataset is a classic benchmark in machine learning. # It's split into 60,000 training images and 10,000 test images. (x_train, y_train), (x_test, y_test) = keras.datasets.mnist.load_data() # For demonstration purposes, we'll use a smaller subset of the original dataset # to reduce training time, especially for a cheatsheet example. # Reshape images: CNNs expect input in the format (batch_size, height, width, channels). # MNIST images are 28x28 pixels and grayscale (1 channel). x_train = x_train[:5000].reshape(-1, 28, 28, 1).astype("float32") / 255.0 # Normalize pixel values to [0, 1] y_train = y_train[:5000] x_test = x_test[:1000].reshape(-1, 28, 28, 1).astype("float32") / 255.0 # Normalize pixel values y_test = y_test[:1000] print(f"Training data shape: {x_train.shape}, {y_train.shape}") print(f"Testing data shape: {x_test.shape}, {y_test.shape}") # 2. Build the CNN Model (Keras Sequential API): # `keras.Sequential` allows us to build a neural network layer by layer. model = keras.Sequential([ # First Convolutional Block: # `layers.Conv2D`: This is the convolutional layer. # `32`: Number of filters (feature detectors) to learn. More filters allow learning more features. # `kernel_size=(3, 3)`: The size of each filter (3x3 pixels). # `activation='relu'`: Applies the ReLU activation function to the output of the convolutions. # `input_shape=(28, 28, 1)`: Specifies the shape of the input images (height, width, channels). layers.Conv2D(32, kernel_size=(3, 3), activation='relu', input_shape=(28, 28, 1)), # `layers.MaxPooling2D`: This layer reduces the spatial dimensions (downsampling). # `pool_size=(2, 2)`: Takes the maximum value from every 2x2 region, effectively halving the feature map's width and height. layers.MaxPooling2D(pool_size=(2, 2)), # Second Convolutional Block: # Similar to the first, but often with more filters to learn more complex patterns. layers.Conv2D(64, kernel_size=(3, 3), activation='relu'), layers.MaxPooling2D(pool_size=(2, 2)), # Flatten Layer: # Converts the 3D output of the convolutional/pooling layers into a 1D vector. # This vector is then fed into the fully connected (Dense) layers for classification. layers.Flatten(), # Fully Connected (Dense) Layers for Classification: # The final `Dense` layer is the output layer. # It has `10` neurons because there are 10 classes (digits 0 through 9) in MNIST. # `activation='softmax'` is used for multi-class classification. It outputs a probability distribution # over the 10 classes, where the sum of probabilities for each image is 1. layers.Dense(10, activation='softmax') ]) # 3. Compile the Model: # This step configures the model for the training process. model.compile( optimizer='adam', # `Adam` is chosen for its efficiency and good performance in many deep learning tasks. # `sparse_categorical_crossentropy` is the appropriate loss function when the target labels (`y_train`) # are integers (e.g., 0, 1, 2, ..., 9) rather than one-hot encoded vectors. loss='sparse_categorical_crossentropy', metrics=['accuracy'] # We want to track the classification accuracy during training and evaluation. ) # Print a summary of the model's architecture, including layer types, output shapes, # and the number of trainable parameters (weights and biases) in each layer. model.summary() # 4. Train the Model: # The `fit` method starts the model training. # `x_train`, `y_train`: The training data and their corresponding labels. # `epochs=5`: The model will make 5 passes over the entire training dataset. # `batch_size=32`: The training data is divided into smaller batches of 32 samples. # The model's weights are updated after processing each batch. # `verbose=1`: Shows a progress bar and training metrics during each epoch. print("\nTraining the CNN model...") model.fit(x_train, y_train, epochs=5, batch_size=32, verbose=1) print("Model training complete.") # 5. Evaluate the Model: # The `evaluate` method assesses the model's performance on the unseen test data. # This provides an unbiased estimate of how well the model generalizes to new data. loss, accuracy = model.evaluate(x_test, y_test, verbose=0) print(f"\nTest Loss: {loss:.4f}") print(f"Test Accuracy: {accuracy*100:.2f}%") # 6. Make Predictions: # Use the trained model to predict the class probabilities for the first few test images. predictions = model.predict(x_test[:5]) # `np.argmax` converts the probability distribution (output by Softmax) for each image # into a single predicted class label (the digit with the highest probability). predicted_classes = np.argmax(predictions, axis=1) print("\nPredictions for first 5 test images:") for i in range(5): print(f"Image {i+1}: Actual Digit: {y_test[i]}, Predicted Digit: {predicted_classes[i]}, Probabilities: {predictions[i].round(2)}") 8. Reinforcement Learning - Q-Learning Concept Q-Learning is a powerful, model-free reinforcement learning algorithm. It belongs to the category of value-based learning algorithms because its primary goal is to learn an optimal "action-value function," often called the Q-function. "Model-free" means the agent doesn't need to explicitly know the rules or dynamics of the environment (i.e., it doesn't need a model of how actions lead to new states and rewards). Instead, it learns by trial and error, interacting with the environment and observing the consequences (rewards and next states) of its actions. The core idea is to learn a "Q-value" for every possible (state, action) pair. The Q-value, $Q(s,a)$, represents the expected total future reward an agent can receive if it takes action $a$ in state $s$ and then follows an optimal policy thereafter. The ultimate goal is to construct a "Q-table" (or Q-matrix) that stores these Q-values, allowing the agent to choose the best action in any given state simply by looking up the action with the highest Q-value. Key Components and Learning Process: Q-table Initialization: A table (or matrix) is created where rows represent states and columns represent actions. All Q-values are typically initialized to zero, signifying the agent's initial lack of knowledge. Episode Iteration: The learning process consists of many "episodes." Each episode is a sequence of state-action transitions from a starting state until a terminal state (goal) is reached or a maximum number of steps is exceeded. State Observation ($s$): At each step within an episode, the agent observes its current state $s$ in the environment. Action Selection ($\epsilon$-Greedy Policy): The agent selects an action $a$ from the current state $s$ using an exploration-exploitation strategy. The most common is the $\epsilon$-greedy policy: Exploration: With a small probability $\epsilon$ (epsilon), the agent chooses a random action. This allows the agent to discover new paths and potentially better rewards, preventing it from getting stuck in local optima. Exploitation: With a probability of $1-\epsilon$, the agent chooses the action with the highest Q-value for the current state. This leverages the agent's current knowledge to maximize immediate and future rewards. Environment Interaction: After taking action $a$, the agent transitions to a new state $s'$ and receives an immediate reward $R$ from the environment. Q-value Update (Bellman Equation): This is the core of Q-learning. The Q-value for the previous (state, action) pair, $Q(s,a)$, is updated using the following formula: $Q(s,a) \leftarrow Q(s,a) + \alpha [R + \gamma \max_{a'} Q(s',a') - Q(s,a)]$ $s$: The original state before taking the action. $a$: The action taken from state $s$. $R$: The immediate reward received after taking action $a$ and landing in $s'$. $s'$: The new state reached after taking action $a$. $a'$: All possible actions from the new state $s'$. $\alpha$ (Learning Rate, $0 $\gamma$ (Discount Factor, $0 \le \gamma $\max_{a'} Q(s',a')$: Represents the maximum possible Q-value that can be obtained from the next state $s'$ by taking any possible action $a'$. This is the "greedy" choice for the next state, assuming optimal future behavior. Episode Completion: The process (steps 3-6) repeats until the agent reaches a terminal state (e.g., goal achieved, game over) or a predefined maximum number of steps is reached. Epsilon Decay: Often, the $\epsilon$ value is gradually decreased over episodes. This encourages the agent to explore more in the beginning and then exploit its learned knowledge more as training progresses. State S State S' Action A Reward R $\max Q(s',a')$ Agent Environment Implementation (Python basic) This implementation demonstrates Q-Learning in a simple 3x3 grid world. The agent's goal is to navigate from any starting state to the goal state (2,2) while maximizing cumulative rewards and avoiding penalties. import numpy as np import random # For epsilon-greedy action selection print("--- Q-Learning Example (Gridworld) ---") # 1. Define the Environment: # R = Rewards matrix for a 3x3 grid. # States are represented by (row, col) tuples. # Columns: (0,0) (0,1) (0,2) # Rows: # 0: [ 0, 0, -1] (-1 indicates a penalty state) # 1: [ 0, 0, 0] # 2: [-1, 0, 10] (10 indicates a large reward, which is our goal state (2,2)) R = np.array([ [0, 0, -1], [0, 0, 0], [-1, 0, 10] ]) # Define possible actions an agent can take: Up, Down, Left, Right. # These are represented as changes in (row, col) coordinates. actions = [(-1, 0), (1, 0), (0, -1), (0, 1)] # Index mapping: 0=Up, 1=Down, 2=Left, 3=Right num_actions = len(actions) num_states_r, num_states_c = R.shape # Get the dimensions of the grid (3 rows, 3 columns) # 2. Initialize Q-table: # The Q-table stores the Q-value for each possible (state, action) pair. # Its dimensions are (number_of_rows, number_of_columns, number_of_actions). # Initially, all Q-values are set to zero, as the agent has no experience. Q = np.zeros((num_states_r, num_states_c, num_actions), dtype=float) # 3. Hyperparameters for Q-Learning: gamma = 0.9 # Discount factor: Determines the importance of future rewards. A value closer to 1 makes the agent more farsighted. alpha = 0.1 # Learning rate: Controls how much new information (from the Bellman equation) updates the old Q-value. epsilon = 0.2 # Epsilon for epsilon-greedy action selection: # - With probability `epsilon`, the agent explores (chooses a random action). # - With probability `1 - epsilon`, the agent exploits (chooses the action with the highest Q-value). n_episodes = 1000 # Number of training episodes. Each episode is a complete run from a start state to a goal/terminal state. # 4. Helper Functions: # Checks if a given state (row, col) is within the grid boundaries. def is_valid_state(state): return 0