Financial Management Cheatsheet
Cheatsheet Content
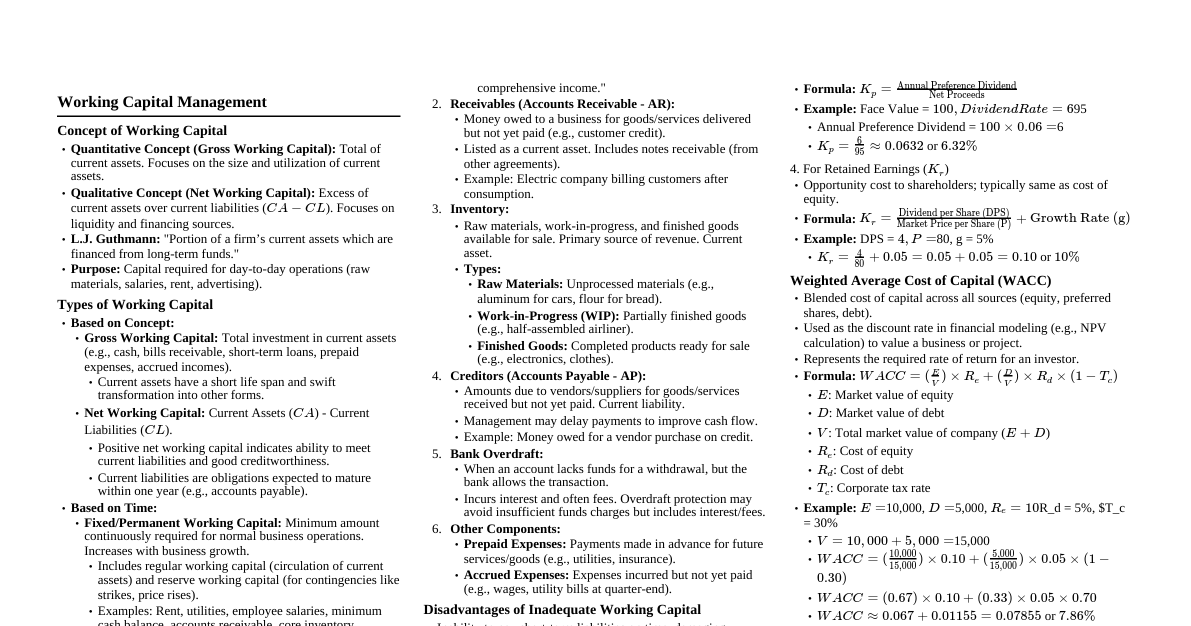
Working Capital Management Concept of Working Capital Quantitative Concept (Gross Working Capital): Total of current assets. Focuses on the size and utilization of current assets. Qualitative Concept (Net Working Capital): Excess of current assets over current liabilities ($CA - CL$). Focuses on liquidity and financing sources. L.J. Guthmann: "Portion of a firm's current assets which are financed from long-term funds." Purpose: Capital required for day-to-day operations (raw materials, salaries, rent, advertising). Types of Working Capital Based on Concept: Gross Working Capital: Total investment in current assets (e.g., cash, bills receivable, short-term loans, prepaid expenses, accrued incomes). Current assets have a short life span and swift transformation into other forms. Net Working Capital: Current Assets ($CA$) - Current Liabilities ($CL$). Positive net working capital indicates ability to meet current liabilities and good creditworthiness. Current liabilities are obligations expected to mature within one year (e.g., accounts payable). Based on Time: Fixed/Permanent Working Capital: Minimum amount continuously required for normal business operations. Increases with business growth. Includes regular working capital (circulation of current assets) and reserve working capital (for contingencies like strikes, price rises). Examples: Rent, utilities, employee salaries, minimum cash balance, accounts receivable, core inventory. Temporary/Variable Working Capital: Required to meet seasonal demands or special exigencies. Includes seasonal working capital (e.g., for peak seasons) and special working capital (e.g., for marketing campaigns, research). Examples: Extra cash for a construction project, seeds/fertilizers for farms, holiday inventory for retailers, funds for a new tech contract. Components of Working Capital 1. Cash and Cash Equivalents: Cash: Currency, bills, coins, money orders, cashier's checks, demand deposit accounts (checking, savings). Cash Equivalents: Highly liquid investments, easily convertible to cash, short-term (max 90 days maturity), known market price, minimal price fluctuations. Examples: Marketable securities (excluding stocks/long-term bonds), Treasury Bills, short-term government bonds, Banker's Acceptance, Commercial Paper, Money Market Accounts, Certificates of Deposit (depending on maturity). Foreign currency holdings introduce exchange risk; translation losses are reported in "accumulated other comprehensive income." 2. Receivables (Accounts Receivable - AR): Money owed to a business for goods/services delivered but not yet paid (e.g., customer credit). Listed as a current asset. Includes notes receivable (from other agreements). Example: Electric company billing customers after consumption. 3. Inventory: Raw materials, work-in-progress, and finished goods available for sale. Primary source of revenue. Current asset. Types: Raw Materials: Unprocessed materials (e.g., aluminum for cars, flour for bread). Work-in-Progress (WIP): Partially finished goods (e.g., half-assembled airliner). Finished Goods: Completed products ready for sale (e.g., electronics, clothes). 4. Creditors (Accounts Payable - AP): Amounts due to vendors/suppliers for goods/services received but not yet paid. Current liability. Management may delay payments to improve cash flow. Example: Money owed for a vendor purchase on credit. 5. Bank Overdraft: When an account lacks funds for a withdrawal, but the bank allows the transaction. Incurs interest and often fees. Overdraft protection may avoid insufficient funds charges but includes interest/fees. 6. Other Components: Prepaid Expenses: Payments made in advance for future services/goods (e.g., utilities, insurance). Accrued Expenses: Expenses incurred but not yet paid (e.g., wages, utility bills at quarter-end). Disadvantages of Inadequate Working Capital Inability to pay short-term liabilities on time, damaging reputation and credit. Cannot buy in bulk or avail discounts. Difficulty exploiting favorable market conditions or undertaking profitable projects. Reduced rate of return on investments. Inability to pay day-to-day expenses, leading to inefficiencies, increased costs, and reduced profits. Difficulty in Meeting Short-Term Obligations: Production delays (e.g., unable to pay for raw materials). Disruption in Business Operations: Operational slowdowns, lost sales (e.g., unable to replenish inventory). Damage to Creditworthiness: Higher interest rates or denial of future credit. Difficulty in Securing New Financing: Financial institutions reluctant to lend. Loss of Business Opportunities: Missing out on bulk purchasing discounts or expansion. Increased Borrowing Costs: Reliance on high-interest short term loans. Risk of Insolvency or Bankruptcy: Prolonged shortages can lead to liabilities exceeding assets. Principles of Working Capital Management 1. Principle of Optimization: Maintain working capital at an optimum level where the rate of return on investment is maximized, and each rupee invested adds to net value. 2. Principle of Risk Variation: The rate of return is linked to risk. As working capital relative to sales decreases, risk and potential for gain/loss increase. A balance is needed. 3. Principle of Cost of Capital: Different sources have different costs and risks. Capital should be raised to balance risk, profit, and cost. 4. Principle of Maturity of Payment: Working capital sources should be matched with the firm's ability to repay on maturity from cash inflows, not just profits. 5. Principle of Equity Position: Working capital investment should be justified by the firm's equity position, contributing to its net worth. Factors Determining Working Capital Requirement 1. Nature of Companies: E.g., public utilities need more fixed assets, merchandising needs more inventory/receivables. 2. Demand of Creditors: Creditors seek security; companies need sufficient current assets to cover obligations. 3. Cash Requirements: Minimum cash level for operations and good credit relations. 4. Nature and Size of Business: Trading/financial firms need less fixed assets, more working capital. Manufacturing varies. 5. Time: Longer manufacturing time means greater working capital. Depends on inventory turnover and unit cost. 6. Volume of Sales: Directly related; higher sales require more working capital for operations, inventory, receivables. 7. Terms of Purchases and Sales: Favorable purchase terms (longer credit) reduce needs; liberal sales terms (longer credit to customers) increase needs. 8. Business Cycle: More working capital needed during prosperity, less during depression. 9. Production Cycle: Longer cycle (raw material to finished product) requires greater working capital. Shorten to minimize. 10. Liquidity and Profitability: Higher risk tolerance (for bigger gains/losses) may reduce working capital (lower liquidity, higher profitability potential). Improving liquidity increases working capital but may reduce sales/profitability. 11. Seasonal Fluctuations: Seasonal demand affects variable working capital. Inventory purchases during specific seasons. Cost of Capital What is Cost of Capital? The sacrifice made by investors to invest, expecting a fair return. The price paid to the investor for the use of capital provided. Reward for the use of capital. Importance of Cost of Capital 1. Designing the Capital Structure: Minimizing cost of capital while maximizing firm value. 2. Capital Budgeting Decisions: Investment proposals must have a rate of return greater than the cost of capital. 3. Comparative Study of Sources of Financing: Selecting sources with minimum cost, considering risk and control. 4. Evaluations of Financial Performance: Comparing project profitability with the actual cost of capital. 5. Knowledge of Firm's Expected Income and Inherent Risks: High cost of capital can signal lower earnings, higher risk, or imbalanced structure. 6. Financing and Dividend Decisions: Tool for dividend policy, capitalization of profits, and working capital sources. Computation of Cost of Capital 1. For Debentures or Bonds ($K_d$): Effective rate paid on debt, after tax (interest is tax-deductible). Formula (After-tax): $K_d = \frac{\text{Annual Interest}}{\text{Net Proceeds}} \times (1 - \text{Tax Rate})$ Example: Face Value = $1,000$, Coupon = $8\%$, Net Proceeds = $950$, Tax Rate = $30\%$. Annual Interest = $1,000 \times 0.08 = 80$ Pre-tax $K_d = \frac{80}{950} \approx 0.0842$ or $8.42\%$ After-tax $K_d = 8.42\% \times (1 - 0.30) = 8.42\% \times 0.70 \approx 5.894\%$ 2. For Equity Capital ($K_e$): Calculated using the Dividend Discount Model (DDM). Formula: $K_e = \frac{\text{DPS}}{\text{P}} + g$ (where DPS = Dividend per Share, P = Current Market Price per Share, g = Growth Rate) Example: DPS = $5$, P = $100$, g = $4\%$. $K_e = \frac{5}{100} + 0.04 = 0.05 + 0.04 = 0.09$ or $9\%$ 3. For Preference Capital ($K_p$): Preference shareholders receive a fixed dividend. Formula: $K_p = \frac{\text{Annual Preference Dividend}}{\text{Net Proceeds}}$ Example: Face Value = $100$, Dividend Rate = $6\%$, Net Proceeds = $95$. Annual Preference Dividend = $100 \times 0.06 = 6$ $K_p = \frac{6}{95} \approx 0.0632$ or $6.32\%$ 4. For Retained Earnings ($K_r$): Opportunity cost to shareholders; typically same as cost of equity. Formula: $K_r = \frac{\text{DPS}}{\text{P}} + g$ (same as $K_e$) Example: DPS = $4$, P = $80$, g = $5\%$. $K_r = \frac{4}{80} + 0.05 = 0.05 + 0.05 = 0.10$ or $10\%$ Weighted Average Cost of Capital (WACC) Blended cost of capital across all sources (equity, preferred shares, debt). Used as the discount rate in financial modeling (e.g., NPV calculation) to value a business or project. Represents the required rate of return for an investor. Formula: $\text{WACC} = (\frac{E}{V}) R_e + (\frac{D}{V}) R_d (1 - T_c)$ $E$: Market value of equity $D$: Market value of debt $V$: Total market value of company ($E + D$) $R_e$: Cost of equity $R_d$: Cost of debt $T_c$: Corporate tax rate Example: $E = 10,000, D = 5,000, R_e = 10\%, R_d = 5\%, T_c = 30\%$. $V = 10,000 + 5,000 = 15,000$ $\text{WACC} = (\frac{10,000}{15,000}) \times 0.10 + (\frac{5,000}{15,000}) \times 0.05 \times (1 - 0.30)$ $\text{WACC} = (0.67) \times 0.10 + (0.33) \times 0.05 \times 0.70$ $\text{WACC} \approx 0.067 + 0.01155 = 0.07855$ or $7.86\%$ Capital Budgeting What is Capital Budgeting? Process businesses use to evaluate and select long-term investments (e.g., equipment, expansion) that yield future financial returns. Helps align with growth strategies, allocate capital efficiently, and minimize financial risks. Characteristics of Capital Budgeting 1. Long-term Focus: Decisions involve projects with returns over several years. 2. High Initial Costs: Significant upfront investment. 3. Risk and Uncertainty: Future cash flows are uncertain. 4. Irreversible Decisions: Difficult to recover invested funds. 5. Evaluation of Cash Flows: Focuses on projected cash inflows/outflows, not just accounting profits. Process of Capital Budgeting 1. Identifying Investment Opportunities: Aligning opportunities with sales targets and corporate strategy (SWOT analysis). 2. Gathering Investment Proposals: Evaluating and classifying proposals (expansion, welfare, replacement) before submission. 3. Deciding on Projects: Selecting projects offering the best returns, influenced by sanctioning power. 4. Preparation and Appropriation: Classifying investment outlays, potentially using blanket appropriations for smaller investments. 5. Implementation: Converting proposals into concrete projects. Using network techniques like CPM and PERT. 6. Performance Review: Monitoring and comparing actual performance with expected results once operations stabilize. Techniques of Capital Budgeting 1. Payback Period: Period required to recover the initial investment through cash inflows. Formula (for even cash flows): $\text{Payback Period} = \frac{\text{Cash Outlay (Investment)}}{\text{Annual Cash Inflow}}$ Utility: Simple to calculate and understand. Focuses on liquidity. Useful where rapid recovery is crucial. Limitations: Ignores time value of money. Disregards cash flows beyond the payback period. No clear rule for acceptable payback period. Example: Investment = $100,000$, Annual Cash Inflow = $20,000$. Payback = $\frac{100,000}{20,000} = 5$ years. 2. Accounting Rate of Return (ARR): Measures average annual profit as a percentage of initial or average investment. Formula: $\text{ARR} = \frac{\text{Average Annual Profit}}{\text{Initial Investment (or Average Investment)}}$ Utility: Simple to calculate and understand. Uses easily available accounting profits. Provides a percentage for comparison. Limitations: Ignores time value of money. Based on accounting profits, not cash flows. Does not consider project duration. Inconsistent with maximizing market value of shares.